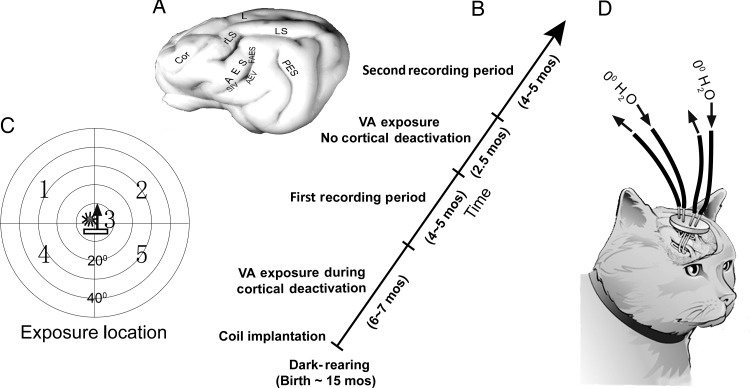
Figure 1.
Experiment design. (A) A schematic of the brain with AES (and rLS) identified and its visual (AEV), auditory (FAES), and somatosensory (SIV) subdivisions. (B) The diagonal timeline shows the periods in which sequential exposure and recording sessions took place. (C) The cross-modal (visual–auditory) exposure stimulus was presented randomly at 5 spatial locations shown on a diagram of visual–auditory (each circle = 10°). The icons at Position 3 depict the cross-modal component stimuli: a bar of light moved in the direction of the arrow, and a stationary noise burst. (D) Removable tubes at the ends of the deactivation coils were used to circulate refrigerated water to deactivate adjacent tissue during the initial cross-modal exposure period.

