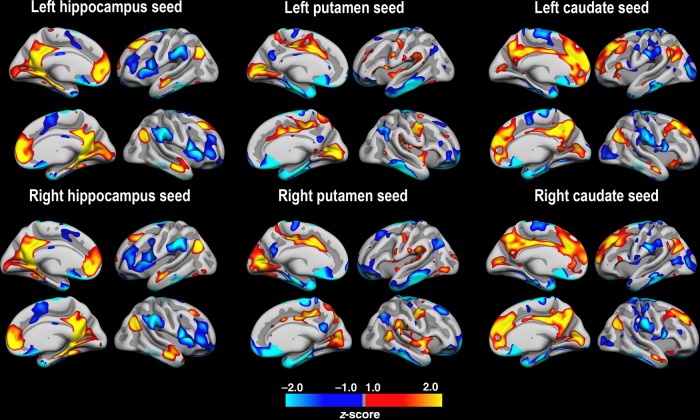
Figure 1.
Cortico-subcortical FC patterns. Resting-state FC (FC) between the 3 seed structures and the cerebral cortex. FC was computed as the mean of the 2 time points. Massive positive relationships were observed, so the maps were z-transformed to allow inspections of regions of relatively higher (red-yellow) versus lower (blue-cyan) FC.

