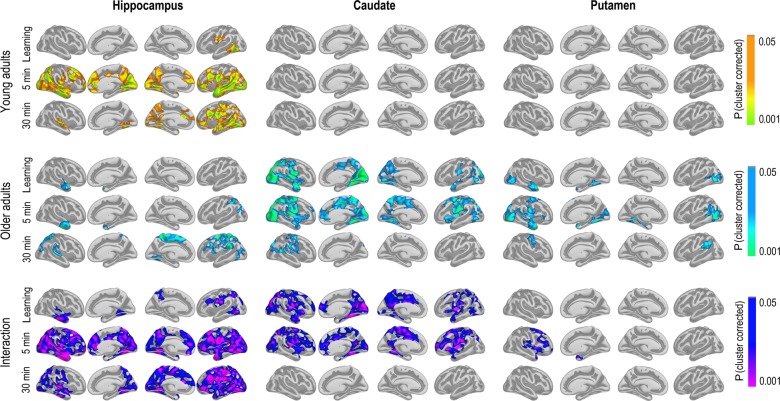
Figure 4.
Maps of the significant relationships between FC change and memory change. The 3 main columns represent the hippocampus, caudate, and putamen as seeds, respectively. The 3 main rows represent the young group, the older group, and the age interactions, for example, the effect of age on the relationship between FC change and memory change. Within each main row, each line represents learning, 5-min recall, and 30-min recall, respectively. The results were corrected for multiple comparisons by Monte Carlo simulations.

