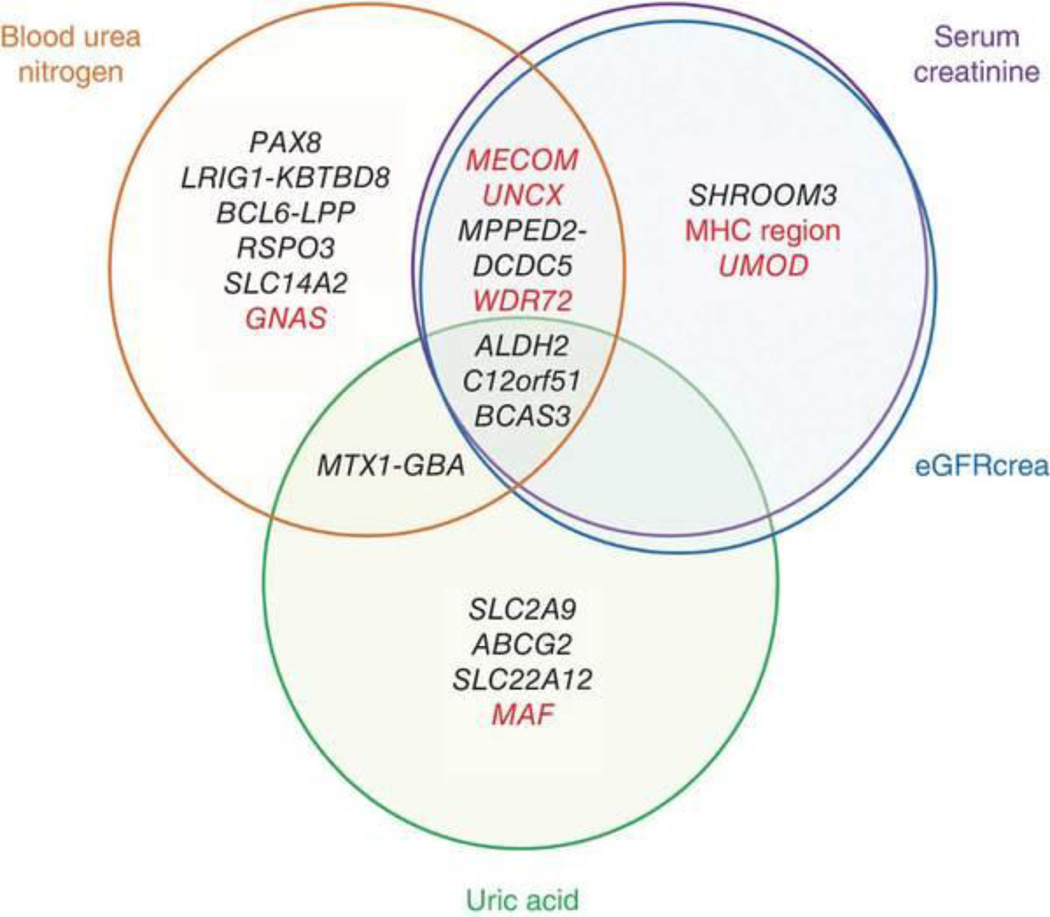
Figure 2. Venn diagram of pleiotropic associations of the identified loci.
Genetic loci identified in the study are classified on the basis of the results of the pleiotropic association study of kidney function–related traits (Table 2 and Supplementary Table 8). Genes that showed significant associations with risk for stage 3+ CKD are colored red.

