. 2016 Jan 18;5:e12345. doi: 10.7554/eLife.12345

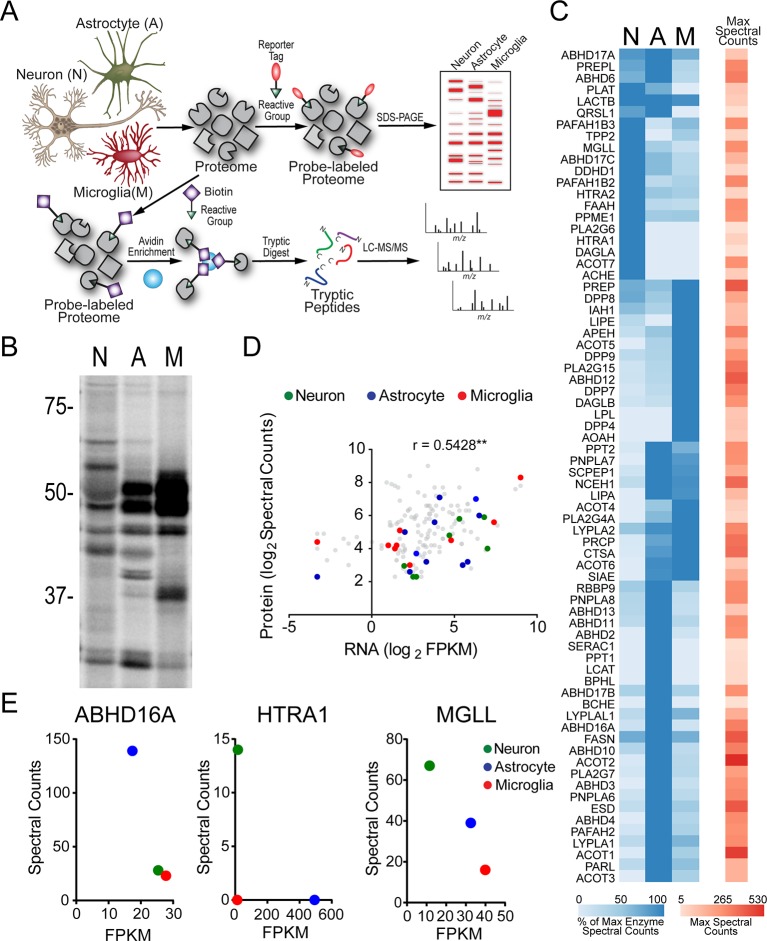
Figure 1. Serine hydrolase activity profiles of mouse brain cell types.
(A) Cartoon scheme of gel- and MS-based activity-based protein profiling (ABPP) methods used to measure serine hydrolase activities in primary mouse neurons, astrocytes, and microglia. For gel-based ABPP, a fluorophosphonate (FP) reactive group conjugated to a rhodamine reporter tag (red oval; FP-Rh) is used (Patricelli et al., 2001). For MS-based ABPP (ABPP-MudPIT), an FP reactive group conjugated to a biotin reporter tag (purple diamond; FP-biotin) is used (Liu et al., 1999). (B) Gel-based ABPP of membrane proteomes from different brain cell types. (C) Hierarchically clustered heatmap of ABPP-MudPIT data (left) for serine hydrolases detected in neurons (N), astrocytes (A) and microglia (M). Data represent the mean spectral count values for each serine hydrolase (from four independent experiments) expressed as % of cell type with maximum number of spectral counts (right heatmap shows the maximum spectral counts among cell types for each serine hydrolase). (D) Relationship between serine hydrolase activities, as measured by ABPP-MudPIT, and previously reported mRNA expression for these enzymes, as measured by RNA-Seq (Zhang et al., 2014), in neurons, astrocytes, and microglia. Serine hydrolases showing ≥ three-fold enrichment in activity in a specific cell type as measured by ABPP-MudPIT are shown as filled colored circles and a Pearson’s correlation reported for the aggregate correlation between their ABPP and RNAseq profiles (r = 0.54; p < 0.01). (E) Examples of serine hydrolases where activity and mRNA expression measurements were uncorrelated (ABHD16A, HTRA1) or anti-correlated (MGLL).

DOI: http://dx.doi.org/10.7554/eLife.12345.003

Figure 1—source data 1. Serine hydrolases identified in neuron, astrocyte, and microglia proteomes by ABPP-MudPIT.
Peptide spectral counts (SC) of serine hydrolases in neuron, astrocyte and microglia proteomes. Average SC values of four individual ABPP-MudPIT experiments ± SEM are reported for proteins identified with a minimum of five SCs in at least one cell type.
elife-12345-fig1-data1.docx (109.3KB, docx)
DOI: 10.7554/eLife.12345.004

Figure 1.

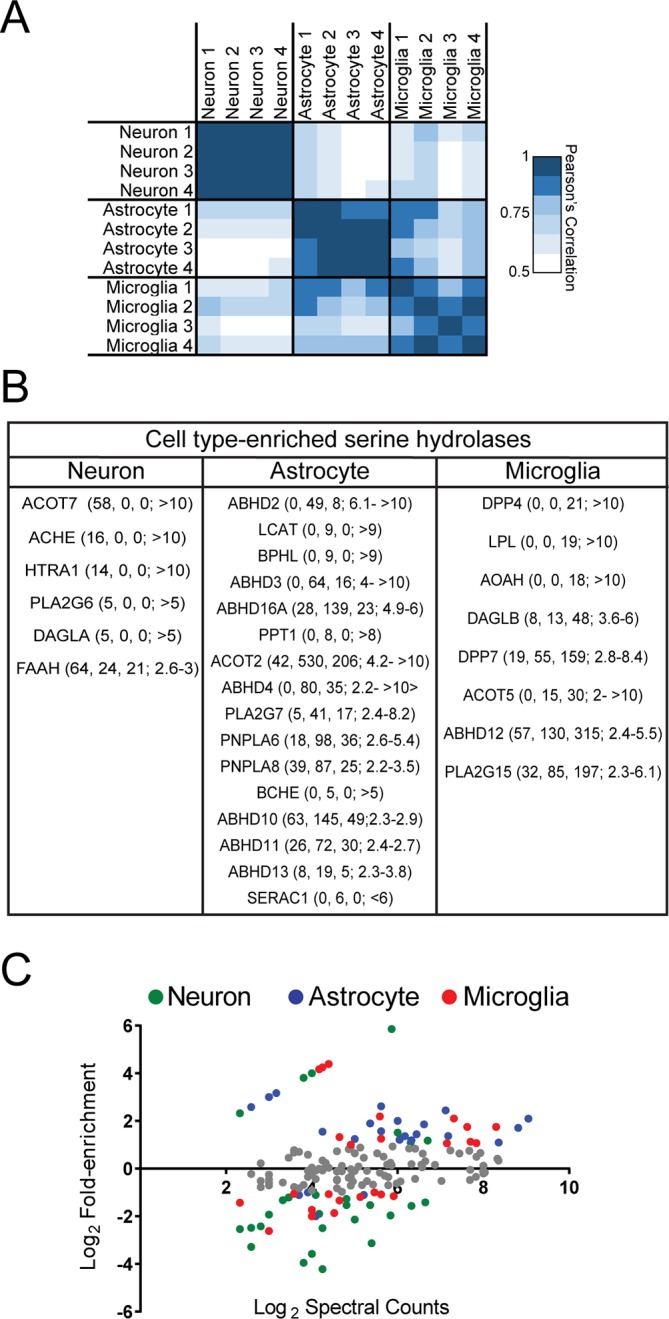
Figure 1—figure supplement 1. Serine hydrolase activity profiles of mouse brain cell types.

Figure 1—figure supplement 1.

(A) Heat map of Pearson’s correlation between spectral count values for serine hydrolases in biologically independent replicates of ABPP-MudPIT experiments performed on mouse primary neurons, astrocytes, and microglia. Each replicate consists of cells derived from 5-10 pooled brains. (B) Cell type enriched serine hydrolases displaying at least two-fold greater number of spectral counts in one cell type compared to the other two. Average spectral counts for neurons, astrocytes, and microglia, as well as fold-enrichment are reported from left to right in the table. (C) Relationship between fold-enrichment and average activity measurements for serine hydrolases in specific cell types. Fold-enrichment values were defined as spectral counts for a serine hydrolase in a given cell type divided by the average spectral count number for that serine hydrolase in all three cell types. Average activity measurements correspond to the mean spectral count for each serine hydrolase within a given cell type (from four replicates). Enzymes that did not meet a two-fold enrichment cutoff for cell type-specific expression are shown in grey.
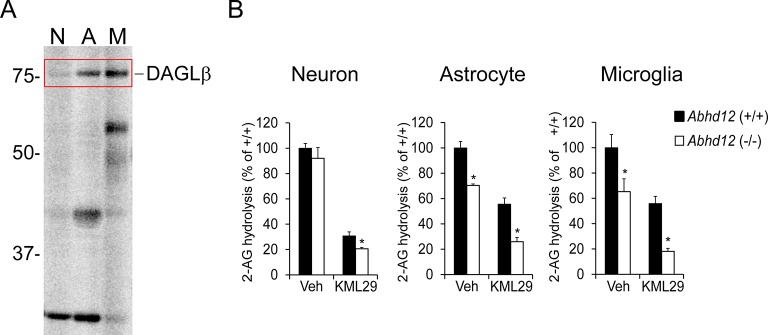
Figure 1—figure supplement 2. DAGLβ and ABHD12 activities are enriched in microglia.

Figure 1—figure supplement 2.

(A) Gel-based ABPP analysis of membrane proteomes from different brain cell types using a DAGL-directed probe (HT01) (Hsu et al., 2012) shows enriched DAGLβ activity in microglia. (B) 2-AG hydrolytic activities of neuron, astrocyte, and microglia membrane proteomes derived from Abhd12+/+ and Abhd12–/– mice basally or following pre-treatment with the MGLL inhibitor KML29 (250 nM, 1 hr). While MGLL was found to be the major 2-AG hydrolase in all three brain cell types, the proportion of ABHD12-dependent 2-AG hydrolysis was greater in astrocytes and, in particular, microglia compared to neurons. Data represent average values ± SEM; N = 5 per cell type, genotype, and treatment. *p < 0.05 and **p < 0.01 for Abhd12–/– groups vs corresponding Abhd12+/+ groups.