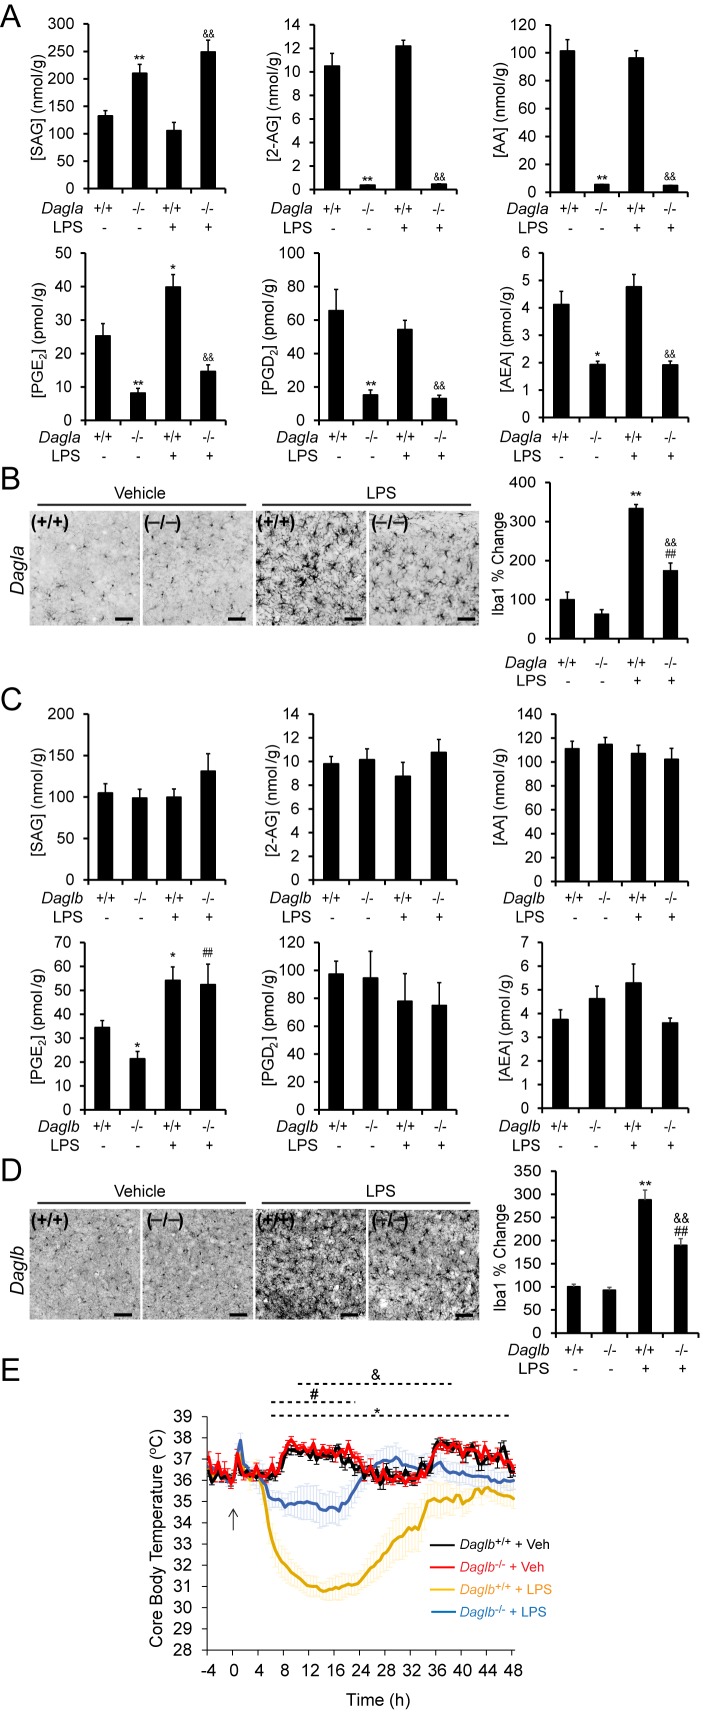
Figure 6. DAGL blockade attenuates microglial neuroinflammatory responses in vivo.
(A) SAG, 2-AG, AA, PGE2, PGD2 and AEA content in brain tissue from Dagla–/– mice and wild-type littermates basally and following exposure to LPS (i.p., 1 mg/kg once per day for 4 days). Data represent average values ± SEM; N = 5-6 per genotype and treatment. *p < 0.05 and **p < 0.01 for vehicle-treated Dagla–/– group or LPS-treated Dagla+/+ group vs vehicle-treated Dagla+/+ group; &&p < 0.01 LPS-treated Dagla–/– group vs LPS-treated Dagla+/+ group. (B) Representative pictures and quantification of microglial activation assessed by Iba-1 staining (a microglia marker that becomes upregulated during inflammatory activation of these cells) in hippocampal regions from Dagla–/– mice and wild-type littermates basally and following exposure to LPS (i.p., 1 mg/kg once per day for 4 days). Scale bar, 50 µm. Data represent average values ± SEM; N = 6 per genotype and treatment. **p < 0.01 for LPS-treated Dagla+/+ group vs vehicle-treated Dagla+/+ group; ##p < 0.01 for LPS-treated Dagla–/– group vs vehicle-treated Dagla–/– group; &&p < 0.01 for LPS-treated Dagla–/– group vs LPS-treated Dagla+/+ group. (C) SAG, 2-AG, AA, PGE2, PGD2 and AEA content in brain tissue from Daglb–/– mice and wild-type littermates basally and following exposure to LPS (i.p., 1 mg/kg once per day for 4 days). Data represent average values ± SEM; N = 5-6 per genotype and treatment. *p < 0.05 for vehicle-treated Daglb–/– group or LPS-treated Daglb+/+ group vs vehicle-treated Daglb+/+ group; ##p < 0.01 for LPS-treated Daglb–/– group vs vehicle-treated Daglb–/– group. (D) Representative pictures and quantification of microglial activation assessed by Iba-1 staining (a microglia marker that becomes upregulated during inflammatory activation of these cells) in hippocampal regions from Daglb–/– mice and wild-type littermates basally and following exposure to LPS (i.p., 1 mg/kg once per day for 4 days). Scale bar, 50 µm. Data represent average values ± SEM; N = 6 per genotype and treatment. **p < 0.01 for LPS-treated Daglb+/+ group vs vehicle-treated Daglb+/+ group; ##p < 0.01 for LPS-treated Daglb–/– group vs vehicle-treated Daglb–/– group; &&p < 0.01 for LPS-treated Daglb–/– group vs LPS-treated Daglb+/+ group. (E) Time course of body temperature changes in Daglb+/+ and Daglb–/– mice following LPS (10 mg/kg, i.p.)-induced anapyrexia. Data represent average values ± SEM; N = 6 mice per genotype and treatment. *p < 0.05 for Daglb+/+ + Veh vs Daglb+/+ + LPS groups; #p < 0.05 for Daglb–/– + Veh vs Daglb–/– + LPS groups; &p < 0.05 for Daglb+/+ + LPS vs Daglb–/– + LPS groups.
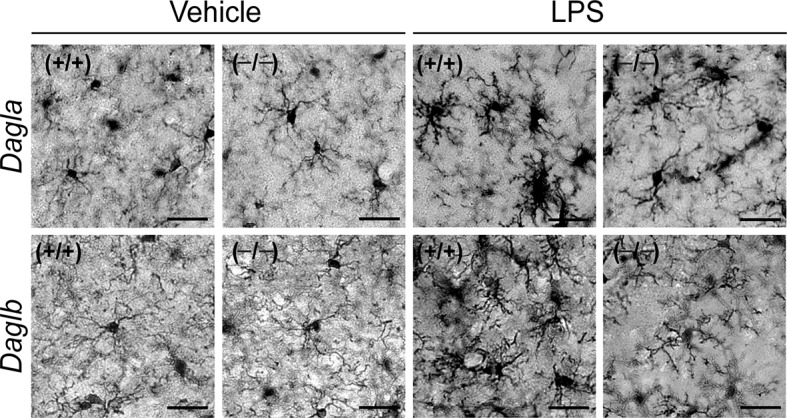
Figure 6—figure supplement 1. DAGL inactivation attenuates LPS-induced microglial activation.


