Figure 1. Alteration of Purkinje cell activity during free whisking.
(A) Videography of a head-restrained mouse with four traced whiskers (from row C, labeled in green). (B) Simplified diagram of the cerebellar circuit (cf: climbing fiber; gc: granule cell; PC: Purkinje cell; pf: parallel fiber; mf: mossy fiber; MI: molecular layer interneuron). (C) PC electrical activity in awake behaving mice, acquired via cell-attached and whole cell patch clamp recordings. Asterisks highlight the incidence of complex spiking. (D) Observed behavior of PC that increased simple spike (SS) frequency during spontaneous whisker movements (gray shading), including (top) traced whisker position (green; upward deflections indicate protraction), (middle) corresponding SS and CS trains, and (bottom) SS instantaneous firing rate histogram (bin size: 100 ms). (E) Observed behavior of PC that decreased SS frequency during spontaneous whisking. (F) Scatter plot showing relative SS firing rate changes during whisking with respect to non-whisking baseline firing rates for all significantly modulated units (p<0.05, n = 47, Mann-Whitney-Wilcoxon test). Red and blue symbols indicate increasing (n = 40) and decreasing (n = 7) PCs, respectively. (G) Relative SS firing rate changes with respect to baseline firing rate between quiet wakefulness and free whisking for all modulated cells (red: increasing PCs, blue: decreasing PCs).

Figure 1—figure supplement 1. Influence of locomotion on simple spike rate alteration during free whisking.

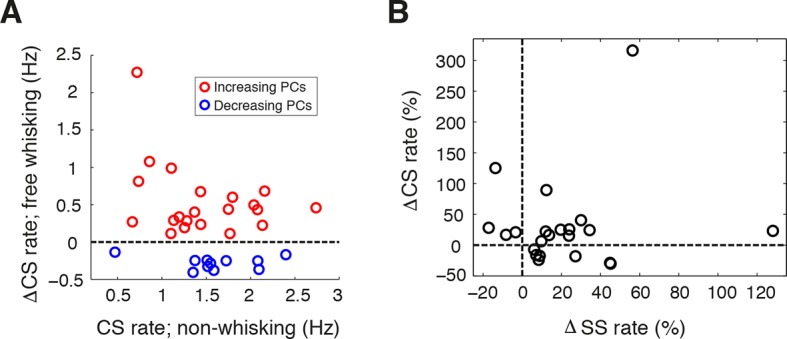
Figure 1—figure supplement 2. Complex spike rate alteration during free whisking.