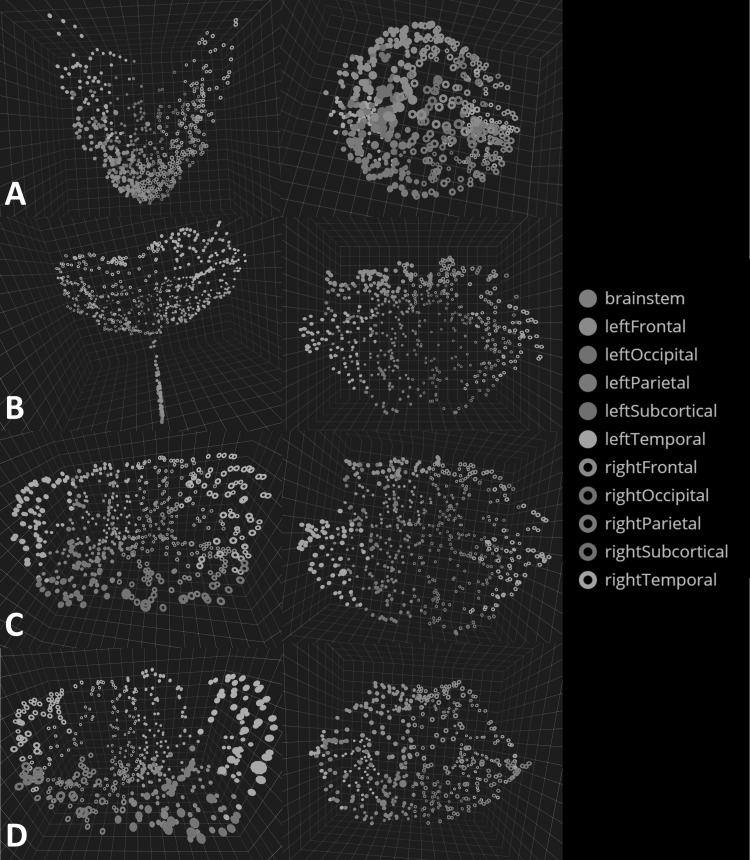
Fig. 3.
a BRAINtrinsic visualization of the transformed MDS brain map with a coronal view (left) and a top or axial view (right). Colors represent different lobes of the brain. Visually, MDS embedding resembles a funnel with a high concentration of nodes near the vertex. b The Isomap topology of the structural brain connectome formed by cortical/subcortical gray matter regions plus the brain stem. Note here brainstem and several subcortical regions are closely embedded in the Isomap, suggesting that they are highly interconnected (while less so with the rest of the brain), which is consistent with known neuroanatomy. c The Isomap topology for the connectome formed by the cortical/subcortical gray matter regions without the brain stem from a coronal (left) and axial (right) viewpoint. Visually resembling a flower, this topology and its simple Euclidean quantifications in Figs. 5 and 6 provide intuitive insight into the relative role each brain region plays, as well as how removal of targeted regions can affect this configuration. We additionally examined the connectome’s topology after removing subcortical structures (d), with results suggesting that in the absence of subcortical regions, the topology remains minimally altered, likely thanks to alternative routing via cortico-cortical connections

