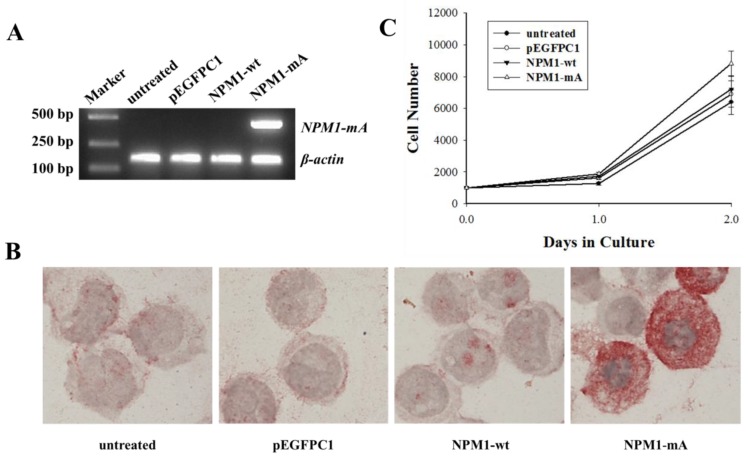
Fig 1.
NPM1-mA mRNA and protein expression and THP-1 cell growth levels after NPM1-mA transfection. (A) The NPM1-mA mRNA expression level was determined by RT-PCR. The cells in the NPM1-mA group expressed NPM1-mA mRNA, but it was not expressed in the NPM1-wt, pEGFPC1 and the untreated groups. (B) Immunocytochemistry staining was performed to evaluate the cytoplasmic localization of NPM1-mA protein (NPMc+). NPMc+ cells were observed in the NPM1-mA group. Three independent experiments were performed and an example of this localization is shown. (C) The cell proliferation potential was evaluated by the cell growth curve. Cell numbers in the four groups were quantified on days, 0, 1 and 2 with a CCK-8 assay. NPM1-mA had no significant effect on cell growth within 2 days (p>0.05). Three independent experiments were performed.

