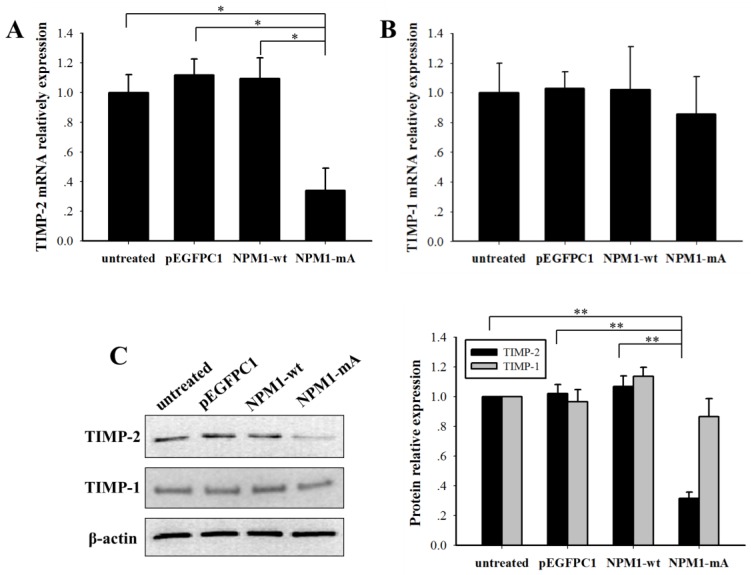
Fig 6.
NPM1-mA expression decreased the TIMP-2 mRNA and protein expression levels in THP-1 cells. (A-B) The TIMP-2/1 mRNA levels were determined using qRT-PCR and the TIMP-2 mRNA in the NPM1-mA group were lower than that in the three control groups (p<0.05), but not TIMP-1 (p>0.05). (C) The TIMP-2/1 protein levels were determined using western blotting and the TIMP-2 protein levels in the NPM1-mA group were lower than that in the three control groups (p<0.01), but not TIMP-1 (p>0.05). All the proteins were quantified using image software and normalized against β-actin. Three independent experiments were performed. *p<0.05 vs. control, **p<0.01 vs. control.

