
Figure 1. Similar proportion of T cells in stable lung transplant recipients and patients with BOS.
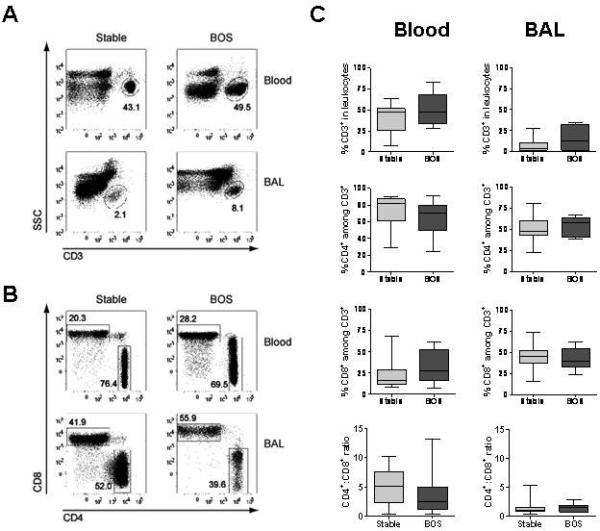
Leukocytes isolated from peripheral blood and BAL were analyzed by flow cytometry for expression of CD3, CD4 and CD8. Numbers in the plots represent the percentage of boxed events within each plot. A. Representative example of flow cytometry identifying the percentage of CD3+ T cells among mononuclear cells following gating of live events. B. Representative example of CD4 and CD8 staining among CD3-gated events. C. Sequential samples for all stable and BOS patients (prior to BOS development) were averaged. Box plots show the median (horizontal line) and the 25th to 75th percentile range. The error bar shows the total range of values.