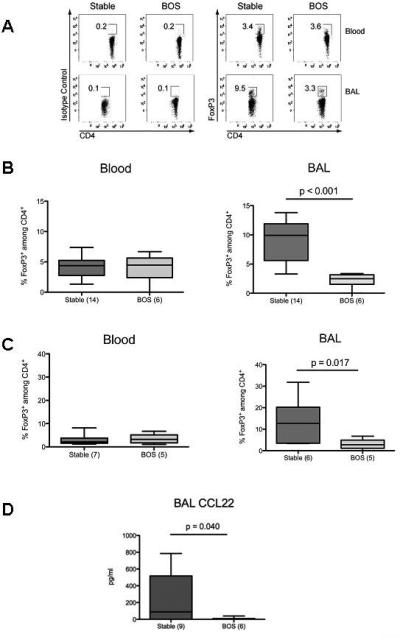
Figure 2. Increased percentage of CD4+FoxP3+ cells and protein level of CCL 22 in the BAL, but not blood, of stable patients versus patients with BOS.

Mononuclear cells from blood and BAL were analyzed by flow cytometry for percentage of FoxP3-expressing cells within CD4+ cells. A. Representative flow cytometry for CD4 versus Foxp3 or its control isotype in blood and BAL samples from stable and BOS patients. The numbers in the plots represent the percentage of events in the boxed areas within that plot. B. The percentages of FoxP3-expressing cells among CD4+ cells in blood and BAL from all samples from each stable or BOS patient (before development of BOS) were averaged and a single value was used per patient. Results represent the median and interquartile ranges of this value in all stable versus all BOS patients. C. The percentages of FoxP3-expressing cells among CD4+ cells in blood and BAL obtained at approximately 1 year post-transplantation in stable patients versus BOS patients (before development of BOS) were averaged in each group and displayed as median and interquartile ranges. D. The protein level of CCL22 from the all BAL samples from each stable or BOS patient prior to development of BOS were averaged and a single value was used per patient. Results represent the median and the interquartile ranges of this value in all stable versus all BOS patients.
