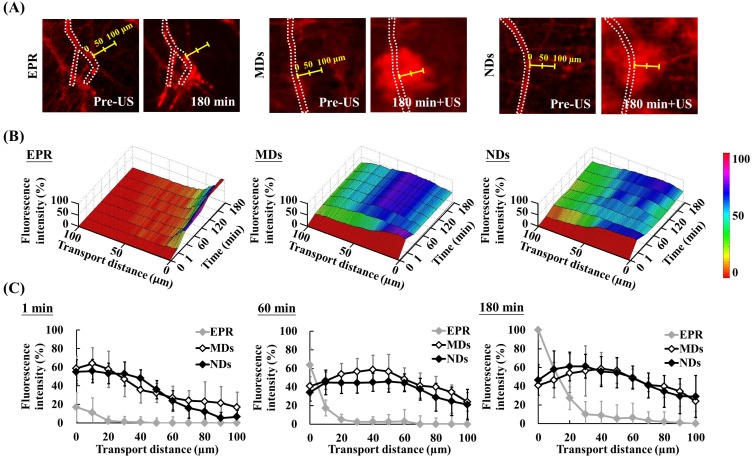
Figure 6.
Evaluation of transport distance. (A) Intravital images in which dotted lines display the vascular structure and yellow scales indicate measurement directions and distances. (B) Time-to-distance maps reveal the association with fluorescence intensity, transport distance, and various time points with US sonication. (C) Fluorescence intensity versus the transport distance at 1, 60, and 180 min.

