Figure 2.
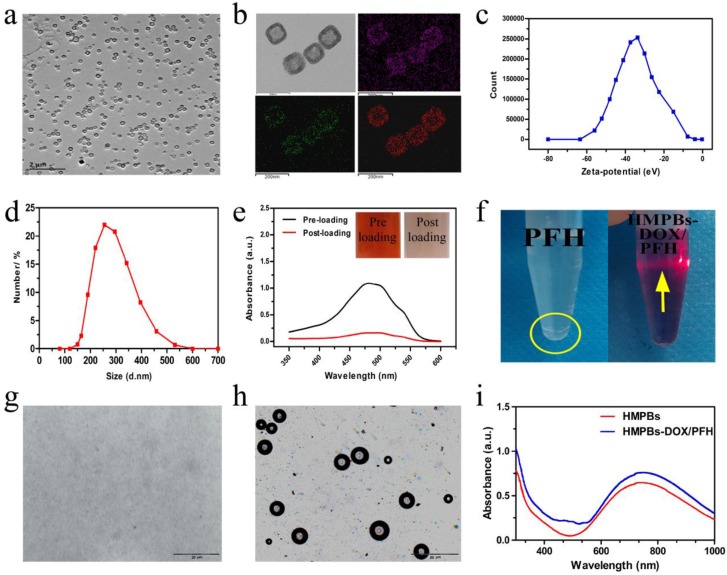
Characterizations of HMPBs-DOX/PFH. (a) A TEM image of HMPBs-DOX/PFH. (b) A high magnification TEM image of HMPBs-DOX/PFH (upper left).The corresponding elemental mappings of HMPBs: carbon, nitrogen and iron (upper right, lower left and right, respectively). (c-d) The size distribution and Zeta potentials of HMPBs-DOX/PFH were measured by dynamic light scattering technique. (e) The UV-vis-NIR spectroscopy of DOX solutions before and after interaction with HMPBs (inset: the representative photos of DOX solution before (left) and after interaction with HMPBs (right)). (f) Digital photos of free PFH and HMPBs-DOX/PFH at the same PFH concentration in PBS (yellow circle indicates the phase-separation of PFH from PBS, yellow arrow indicates tyndall phenomenon). (g-h) Inverted fluorescent microscope images of HMPBs-DOX/PFH at room temperature (g), heated at 63 °C for 10 s (h). (i) The UV-vis-NIR spectroscopy of HMPBs and HMPBs-DOX/PFH.

