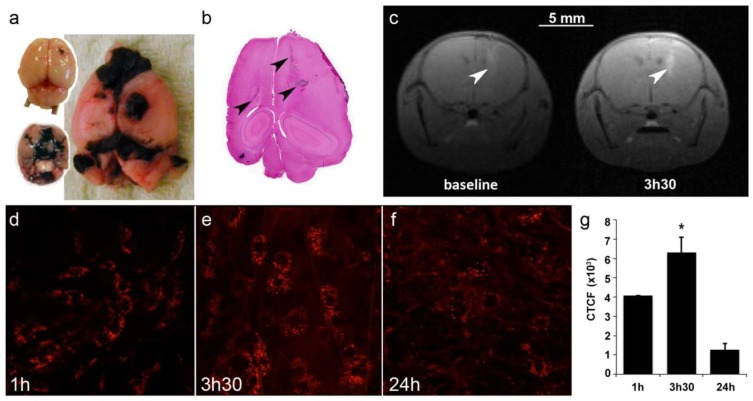
Figure 4.
Brain tumor distribution of AGuIX®. (a) Mouse brains 5 and 10 days after B16F10 implantation and (b) the corresponding H&S section. The arrows indicate the localization of tumor metastases. Note that metastases are black due to the high secretion of melanin. (c) T1-weighted images of the brain of B16F10-bearing mouse (spatial resolution of 156 µm). The images were acquired before and 3.5 hours after an intravenous injection of 0.2 ml of particles (50 g/L) at day 5. The tumors were revealed by the T1-positive particles. (d-f) Intravital two-photon microscopy of labeled particles in subcutaneous B16F10 tumors at 1 hour, 3.5 hours and 24 hours after injection, and (g) the corresponding normalized cell fluorescence (CFCT). CFCT was calculated as CFCT = Integrated Density - (Area of selected cell × Mean fluorescence of background reading).

