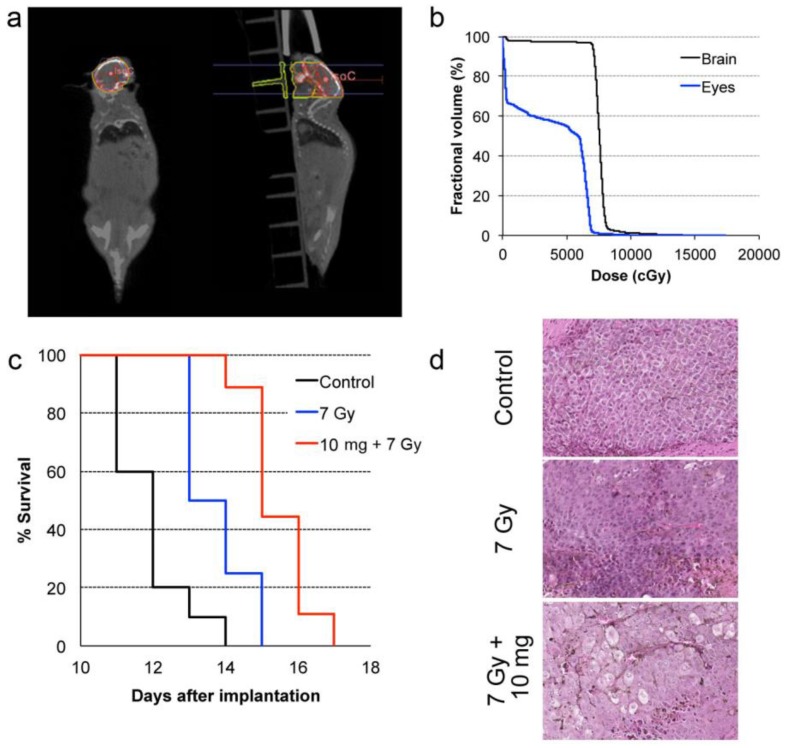
Figure 5.
In vivo radiation exposure in combination with AGuIX®. (a) Coronal and sagittal views from cone-beam CT performed for the treatment planning. The purple lines correspond to the beam, the red line to the 100 % isodose, the orange line to the 75 % isodose, and the green line to the 5 % isodose. (b) Dose-volume histogram (DVH) showing the percentage of the volume receiving the prescribed dose in the brain region, including the metastases and the eyes (7 Gy in 1 fraction with unique vertical beams). (c) Kaplan-Meier survival curve comparison obtained for brain B16F10 metastases-bearing mice without treatment (black curve, n = 10, including 5 mice injected with particles without radiation exposure), those only treated with 7 Gy radiation exposure (blue curve, n = 8), and those treated with a combination of nanoparticles (10 mg, 3.5 hours after IV injection) and 7 Gy radiation exposure (red curve, n = 9) (p < 0.001). (d) H&E staining of brains in the different conditions. Production of melanin might be observed in the metastases.

