Figure 4.

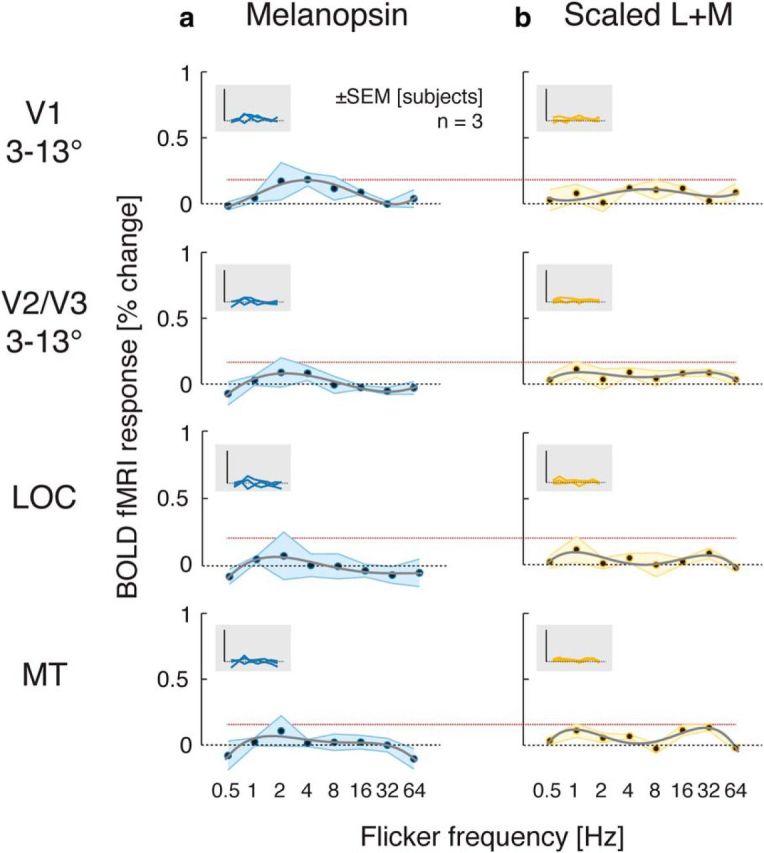
Temporal transfer functions for melanopsin-directed (a) and cone control flicker (b). Same format as Figure 2. Dotted red horizontal lines indicate the peak response (+1 SEM) for the scaled (2% contrast) L + M modulation for each area.

Temporal transfer functions for melanopsin-directed (a) and cone control flicker (b). Same format as Figure 2. Dotted red horizontal lines indicate the peak response (+1 SEM) for the scaled (2% contrast) L + M modulation for each area.