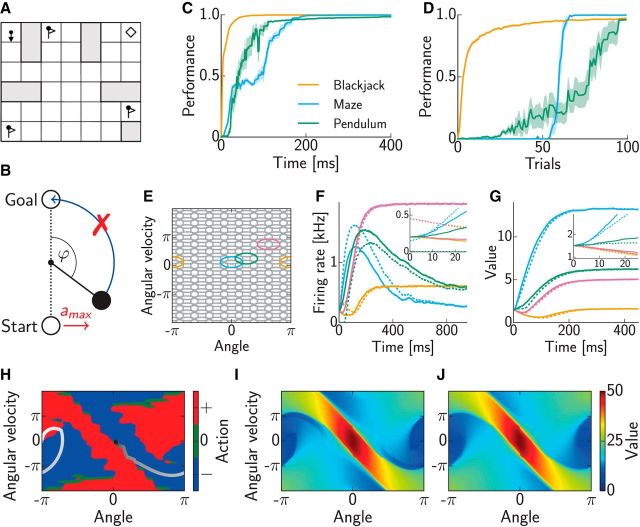
Figure 1.
Reinforcement learning benchmark tasks. A, Maze task (see Materials and Methods for details). B, Pendulum swing-up task (see Materials and Methods for details). C, Convergence of the dynamics toward an optimal policy representation with weights set according to the true environment. Values were computed based on spike counts up to the time indicated on the horizontal axis. Performance shows discounted average (±SEM) cumulative reward obtained by the policy based on these values, normalized such that random action selection corresponds to 0 and the optimal policy corresponds to 1. D, Learning the environmental model through synaptic plasticity. In each trial, first several randomly chosen state–action pairs were experienced and weights in the network were updated accordingly, then the dynamics of the network evolved for 1 s and its performance was measured as in C. E, Distributed representation of the continuous state space in the Pendulum task. Ellipses show 3 SD covariances of the Gaussian basis functions of individual neurons (for better visualization only, every second basis is shown along each axis). F, Activity of four representative neurons during planning. Color identifies the neurons' state-space basis functions as in E, and line style shows two different initial conditions (see inset for better magnification). G, Values of the preferred states of the neurons shown in F as represented by the network over the course of its dynamics. Although both initial state values (inset) and steady-state values coincide in the two examples shown (solid vs dashed lines), the interim dynamics differ because of different neural initial conditions (F, inset). H, Policy (colored areas) and state space trajectory (gray scale circles, temporally ordered from white to black) for pendulum swing-up with preset weights. I, Values actually realized by the network. J, True optimal values for the Pendulum task.

