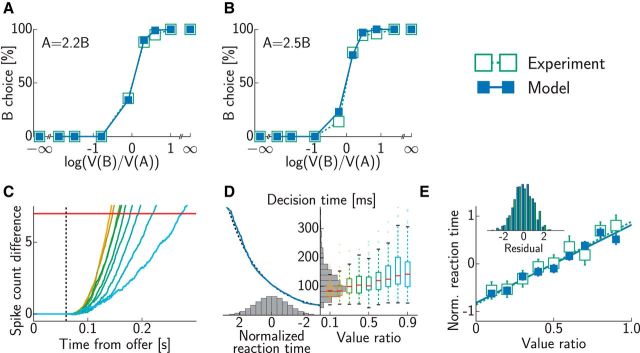
Figure 5.
Psychometric and chronometric curves in a binary decision-making task. A, B, Choice probabilities in experiments (open green squares; Padoa-Schioppa and Assad, 2006) and simulations (filled blue squares) for two different relative values of the two juices: 1A = 2.2B (A) and 1A = 2.5B (B). C, Difference between the cumulative spike counts of populations representing the two potential choices in the model. Accumulation starts with sensory delay (dashed line; compare input onset in Fig. 3B). When a threshold (red line) is reached, a decision is made. Colors indicate different value ratios as in D. D, Decision time distributions in the model. Right, Dependence of raw decision times on the value ratio (colored Tukey's boxplots) and their overall distribution across all value ratios (gray histogram). Left, Normalizing function (solid blue line), together with a logarithmic fit (dashed black line), which transforms the raw decision time distribution into a standard normal distribution (gray histogram). E, Normalized reaction times (±SEM) as a function of value ratio in experiments (open green squares; Padoa-Schioppa and Assad, 2006) and simulations (filled blue squares). Lines show least squares fits (dotted green, experiments; solid blue, simulations); the inset shows distribution of residuals after fitting (green bars, experiments; blue bars, simulations).

