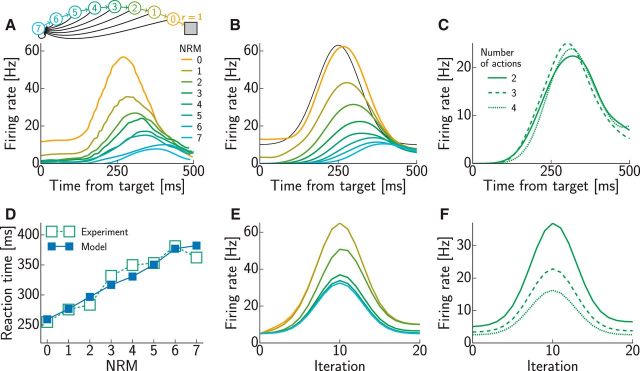
Figure 6.
Sequential decision making. A, An example neuron in pre-SMA showing activity modulated by the NRMs (colored lines; Sohn and Lee, 2007): amplitude decreases and delay increases with NRM. The inset shows task structure: colored circles indicate states (numbers show NRMs), arrows show state transitions (colored lines, correct action; black lines, incorrect action), and the gray square represents terminal state with reward (modeled as r = 1). B, Activity time courses of an example model neuron as a function of NRMs. The color code is the same as in A. The black line shows activity of the reward input chosen to fit experimental data. C, Activity time courses of an example model neuron as a function of the number of available actions (1 correct, others incorrect) in the state with NRM = 3. D, Experimental (open green squares; Sohn and Lee, 2007) and simulated (filled blue squares) reaction times increased approximately linearly with NRMs. Error bars (SEM) are all smaller than the symbols. E, F, Predictions of planning-as-inference for neural time courses as a function of NRMs (E) and number of available actions (F). The color code is the same as in B and C.

