Figure 1.
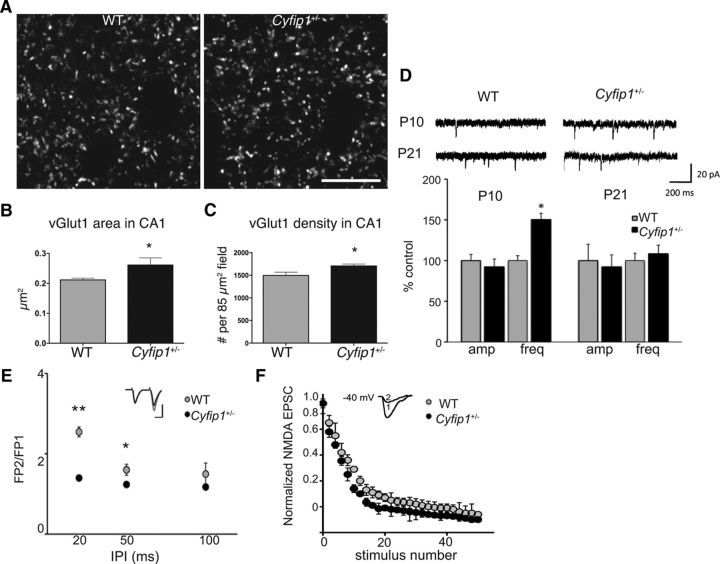
Presynaptic function in Cyfip1+/− neurons is altered in hippocampus. A, Confocal images of vGlut1-labeled single optical sections of CA1 in P10 mice of the indicated genotypes. B, Bar graphs represent an increase in size of vGlut-labeled puncta (t test, 0.011, n = 3 mice each) and density (C) (t test, p = 0.015). Scale bar, 10 μm. D, In whole-cell recordings, mEPSC frequency is increased in hippocampal slices from Cyfip1+/− mice compared with WT at P10 but is not different at P21. Top, Representative traces from whole-cell voltage-clamp recordings of mEPSCs in hippocampal slices from WT and Cyfip1+/− mice. Calibration: 200 ms, 20 pA. Bottom, Bar graphs representing mean amplitude and frequency data (± SEM) for mEPSCs in Cyfip1+/− and WT mice (n = 6 mice/genotype). *p < 0.01 (t test). E, Graph of PPF plots the mean ratio (FP2/FP1) at different interpulse intervals (IPI) in WT and Cyfip1+/− littermates at P10. Cyfip1+/− neurons (black) showed decreased ratio compared with WT (gray) (n = 6 mice/genotype, 1 or 2 slices/animal). **p < 0.001 (t test). *p < 0.01 (t test). Inset, Representative fEPSP traces for PPF (50 ms IPI) from Cyfip1+/− (black) and WT (gray) mouse, with traces normalized to the first response for comparison. Calibration: 0.5 mV, 20 ms. F, Graph of NMDA receptor-mediated EPSCs evoked at 0.1 Hz in the presence of 40 μm MK-801 in Cyfip1+/− (black) and WT (gray) (N = 4 mice/genotype). p = 0.035 (one-way ANOVA). Inset, Representative EPSC traces at the first (1) and the last (2) stimulus in a slice from a Cyfip1+/− mouse. Calibration, same as E.

