
Figure 3.
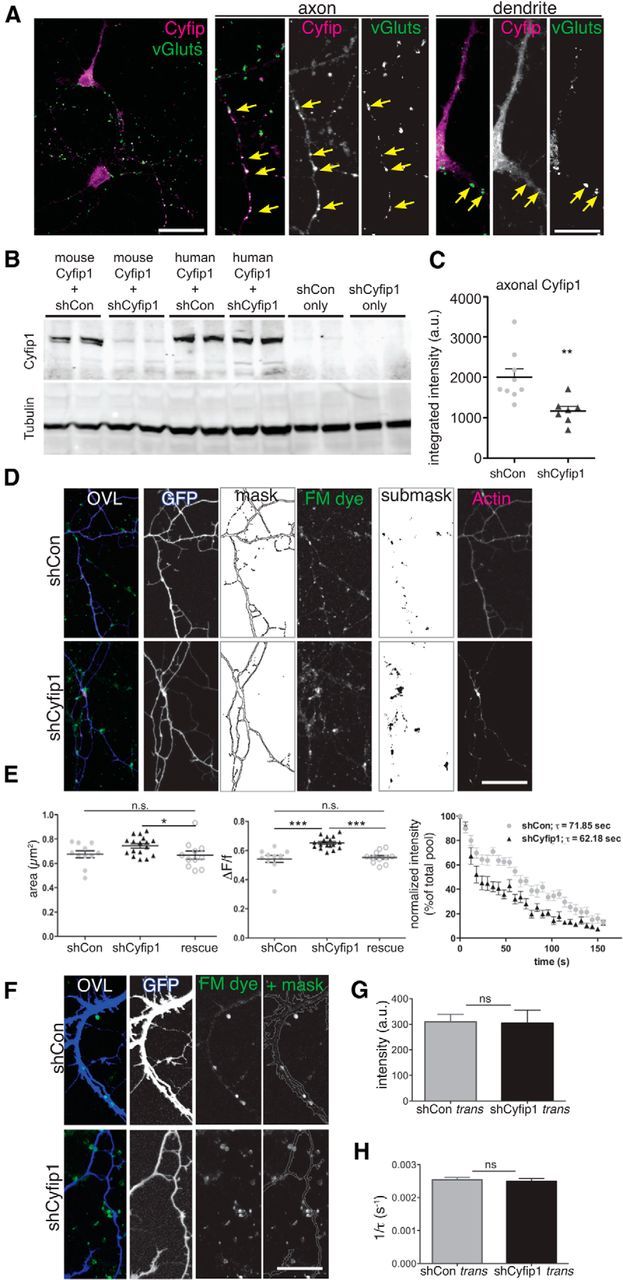
Targeted reduction of presynaptic Cyfip1 increases SV recycling pool size. A, Confocal images represent distribution of endogenous Cyfip1 (magenta) and vGluts1/2/3 (green) in cultured rat hippocampal neurons at 7 DIV. Axonal and somatodendritic regions are shown at higher magnification in panels at right. In axons, Cyfip1 concentrates at vGlut-labeled vesicle clusters (arrows, axon) and, in dendrites, is modestly enriched opposite vGlut clusters as well (arrows, dendrite). Scale bar, 20 μm. Scale bar: inset, 5 μm. B, Western blots of whole-cell lysates of Neuro2A cells expressing either mouse or human Cyfip1 (hCyfip1) together with shCon (nontargeting control short-hairpin vector) or shCyfip1. shCyfip1 reduces only mouse and not hCyfip1. Tubulin was used as a loading control. C, Scatter plot represents mean integrated intensity of Cyfip1 immunofluorescence in axons identified by GFP labeling and expressing either shCon or shCyfip1 (9 shCon and 7 shCyfip1 images). **p = 0.006 (t test). D, Images represent data and quantification strategy: FM4-64 dye-loaded terminals (green in overlay) in transfected axons (GFP, blue in overlay) that are innervating untransfected dendrites in rat hippocampal neurons at DIV 10. Presynaptic actin in this example was visualized by coexpression of eCFP-actin (magenta in overlay). FM-dye labeled sites (or other synaptic markers) were analyzed within a mask that was generated from the image of GFP-expressing axons; other labels, such as CFP-actin, were analyzed within a submask defined by the FM-dye label. Scale bar, 20 μm. E, Scatter plots compare mean (± SEM) and distribution of area (left) and change in intensity (middle) of FM4-64 clusters: shCon (gray), shCyfip1 (black), rescue (white circles; shCyfip1 + hCyfip1); *p = 0.04; ***p = 0.001; FM dye destaining kinetics (right): fluorescence intensity normalized to baseline level of FM dye uptake at axonal terminals as 100% versus time. Each data point indicates an average of five separate experiments, each of which included measurements of ∼20 FM dye-labeled puncta, performed in two cultures transiently transfected with shCon (gray), shCyfip1 (black) short hairpin expression constructs. F, Images of dendrites expressing shCon or shCyfip1 (blue) contacted by FM4-64 labeled (green) clusters at DIV 10 that are contained within a mask. G, Bar graph compares mean FM4-64 dye intensity or destaining rate (H) (± SEM) of FM4-64 puncta-innervating neurons expressing shCon (gray) or shCyfip1 (black). N = 4 separate experiments. ns, Not significant (t test). Scale bar, 30 μm.