
Figure 5.
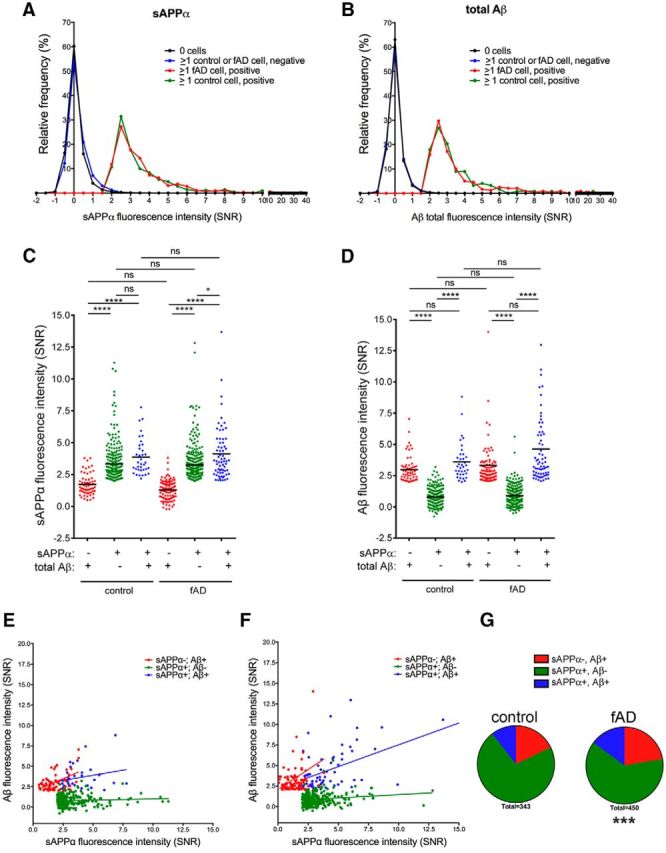
HiPSC-derived neural cells from familial AD and healthy control lines display similar secretion profiles of Aβ and sAPPα. Control and fAD hiPSC lines were differentiated to neural fates for 121 d, followed by dissociation, labeling with calcein violet (control) or calcein red-orange (fAD), and were then mixed and plated in nanowells and imaged. Twenty-four hours later, microengraving was performed for 4 h to detect sAPPα and Aβ, followed by staining with a second viability marker and imaging. Histograms show the distribution of SNR values of wells negative or positive for sAPPα (A) and total Aβ (B). For each graph, data from three arrays are combined. C, D, Fluorescence intensity of sAPPα (C) or total Aβ (D) secreted from three different groupings of single cells (sAPPα−/totalAβ+, sAPPα+/totalAβ−, sAPPα+/totalAβ+). Black lines in C and D denote the mean value for each group. *p < 0.05; ****p < 0.0001, ns = not significant, one-way ANOVA, Kruskal–Wallis multiple-comparisons tests. The correlation of sAPPα and total Aβ fluorescence intensity from each group for control (E) and fAD (F) is shown. Percentages of subpopulations defined by different sAPPα and Aβ secretion profiles were calculated for control and fAD hiPSC-derived neural cells and graphed as pie charts in G. ***p < 0.001, chi-square tests comparing fAD with control (expected).