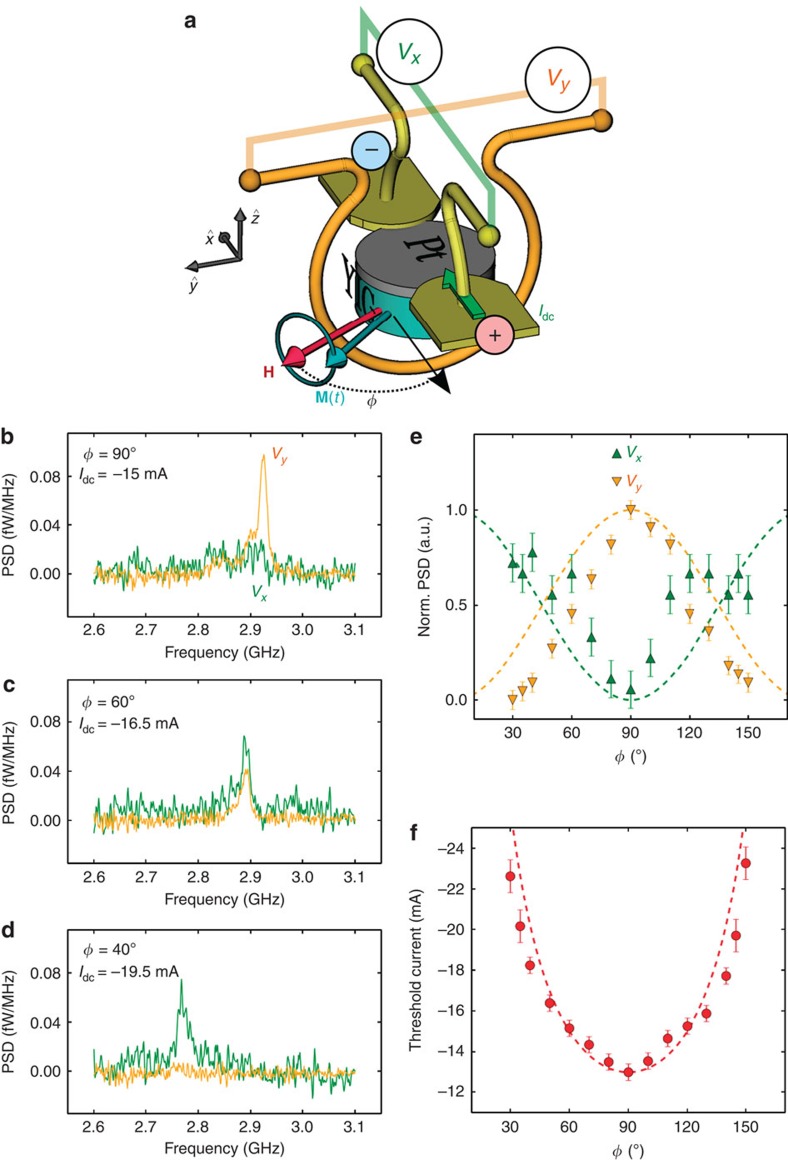
Figure 3. Auto-oscillations as a function of the angle between the d.c. current and the bias field.
(a) Sketch of the sample and measurement configuration. The bias field H is oriented at an angle φ with the d.c. current Idc in the Pt. The precession of the YIG magnetization induces voltages Vx in the antenna and Vy across Pt, which are amplified and monitored by spectrum analysers. (b–d) Vx and Vy at H=0.47 kOe for three different angles φ in the 4-μm disc. (e) Dependence of the normalized signals in both circuits and (f), of the threshold current for auto-oscillations on φ. In e,f dashed lines show the expected angular dependences and error bars are estimated from the limited signal-to-background contrast of the inductive signals.

