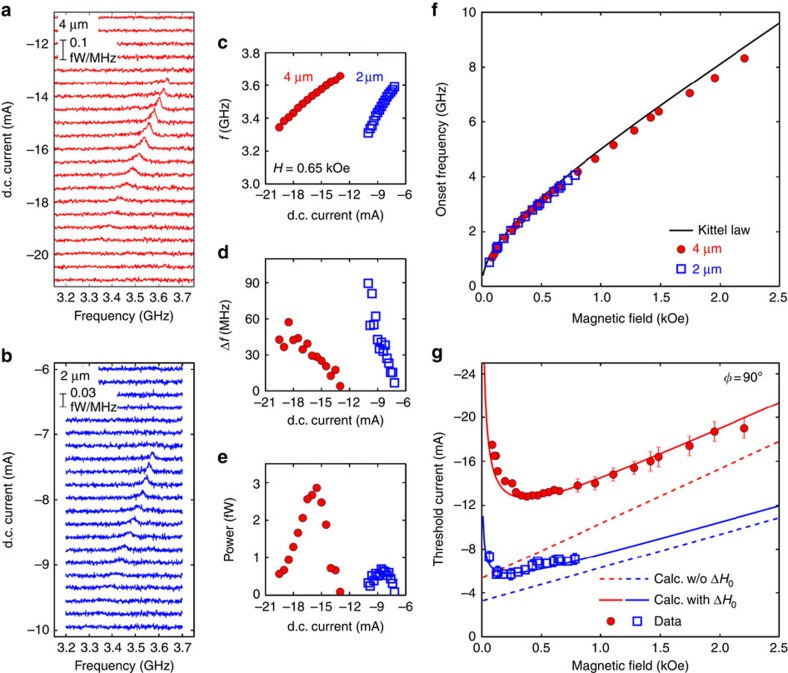
Figure 4. Quantitative analysis of auto-oscillations in YIG|Pt microdiscs.
(a) Inductive voltage Vy produced by auto-oscillations in the 4-μm and (b) 2-μm YIG|Pt discs as a function of the d.c. current Idc in the Pt. The experimental configuration is the same as in Fig. 1a, with the bias field fixed to H=0.65 kOe. (c) Auto-oscillation frequency f, (d) linewidth Δf and (e) integrated power versus Idc. (f) Dependence of the onset frequency and (g) of the threshold current on the applied field in both discs. Expectations taking into account only the homogeneous linewidth or the total linewidth are respectively shown by dashed and continuous lines. Error bars are estimated from the limited signal-to-background contrast of the inductive voltage.

