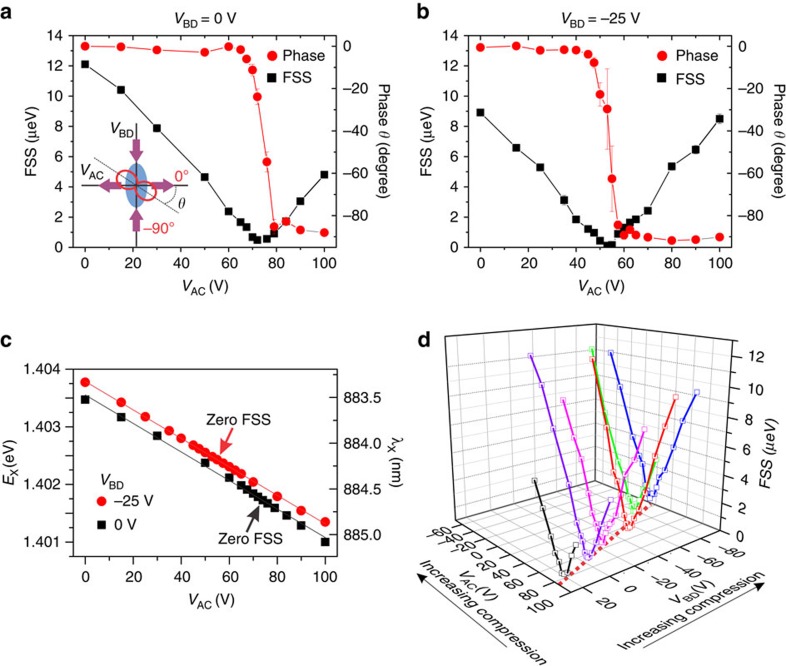
Figure 2. Anisotropic strain engineering of a QD under orthogonal uniaxial stresses.
(a,b) FSS and phase θ are plotted as a function of the voltage VAC at a fixed voltage VBD of 0 and −25 V, respectively. With the increasing voltages on legs A&C, FSS decreases monotonically to around zero and then increases again. And the phase shows an abrupt change from 0 to −90°, when FSS reaches the minimum value. The inset in a gives the definition of θ. The ellipse indicates an elongated QD with its major axis aligned along a crystallographic direction. The red solid line indicates the exciton polarization. The error bars originate from the fitting process. (c) Exciton wavelength is plotted as a function of VAC for the two different VBD. The solid lines are linear fits. The arrows indicate exciton wavelengths at which the FSS are erased. (d) The changes in FSS when both VBD and VAC are scanned. The dashed line on the bottom plane indicates a linear shift of the voltage combination (VAC, VBD) at which FSS reaches the minimum values.

