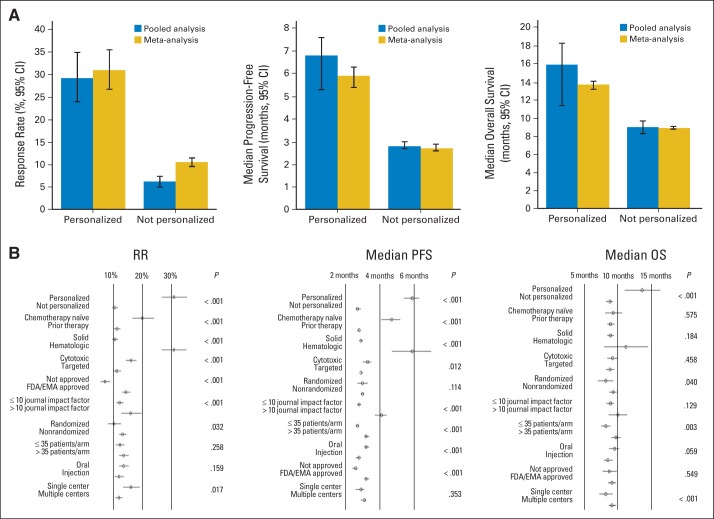
Fig 1.
Benefit of personalized therapy. (A) Results from the pooled and meta-analysis comparing the personalized strategy versus nonpersonalized strategy are represented for response rate (RR), progression-free survival (PFS), and overall survival (OS). All P < .001 comparing arms adopting a personalized approach versus a not personalized approach. Six hundred thirty-eight arms had values available for the RR analysis (pooled analysis and meta-analysis; 112 arms were personalized, and 526 were not). For the PFS analysis, 530 arms had values for the pooled analysis (personalized, n = 86; not personalized, n = 444), and 342 arms had median PFS values and their corresponding 95% CIs available for the meta-analysis (personalized, n = 59; not personalized, n = 283). For the OS analysis, 441 arms had values for the pooled analysis (personalized, n = 49; not personalized, n = 392), and 247 arms had median OS values and their corresponding 95% CIs available for the meta-analysis (personalized, n = 21; not personalized, n = 226). (B) Forest plots for RR, PFS, and OS (left to right). EMA, European Medicines Agency; FDA, US Food and Drug Administration.

