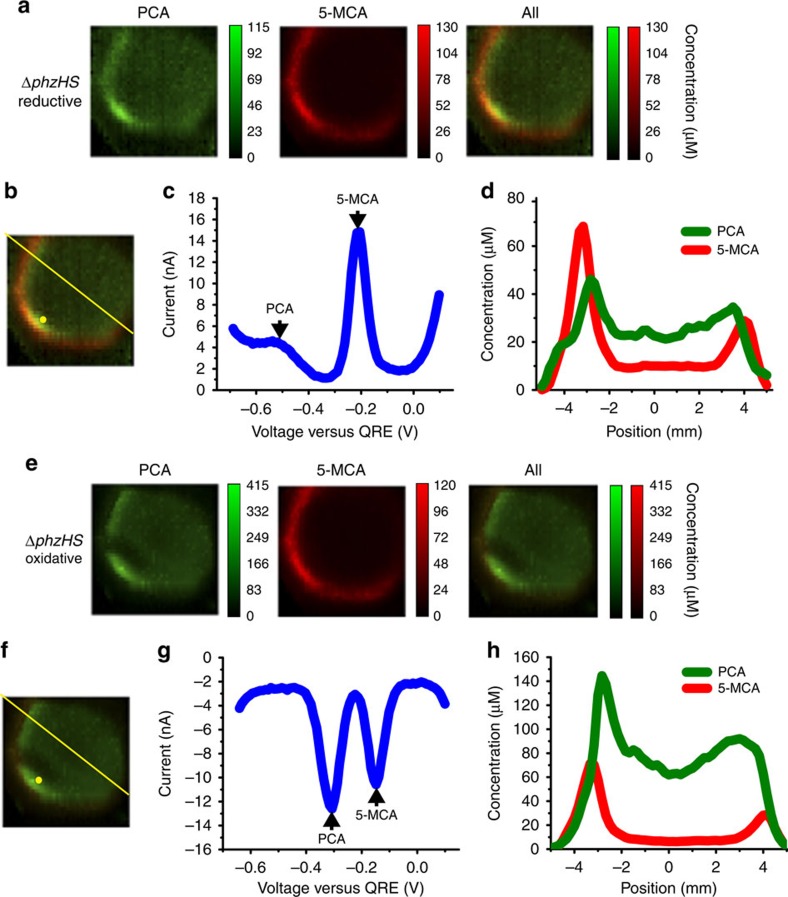
Figure 4. Electrochemical imaging of a ΔphzHS biofilm.
(a) Electrochemical imaging, based on reductive SWV, of a ΔphzHS biofilm after 2 days of development Pixel intensity is proportional to phenazine concentration. PCA, green; 5-MCA, red. Maximum error due to electrode variability is 14 μM for PCA and 15 μM for 5-MCA. Images are 8 mm × 8 mm. (b) Locations of example square-wave voltammogram and cross-section in c,d, respectively. (c) Example square-wave voltammogram from a single electrode. (d) Example cross-section from the electrochemical image in a. (e) Electrochemical imaging, based on oxidative SWV, of the same ΔphzHS biofilm shown in a. Pixel intensity is proportional to phenazine concentration. PCA is shown in green and 5-MCA in red. Maximum error due to electrode variability is 74 μM for PCA and 12 μM for 5-MCA. Images are 8 mm × 8 mm. (f) Locations of example square-wave voltammogram and cross-section in g,h, respectively. (g) Example square-wave voltammogram from a single electrode. (h) Example cross-section from the electrochemical image in e.

