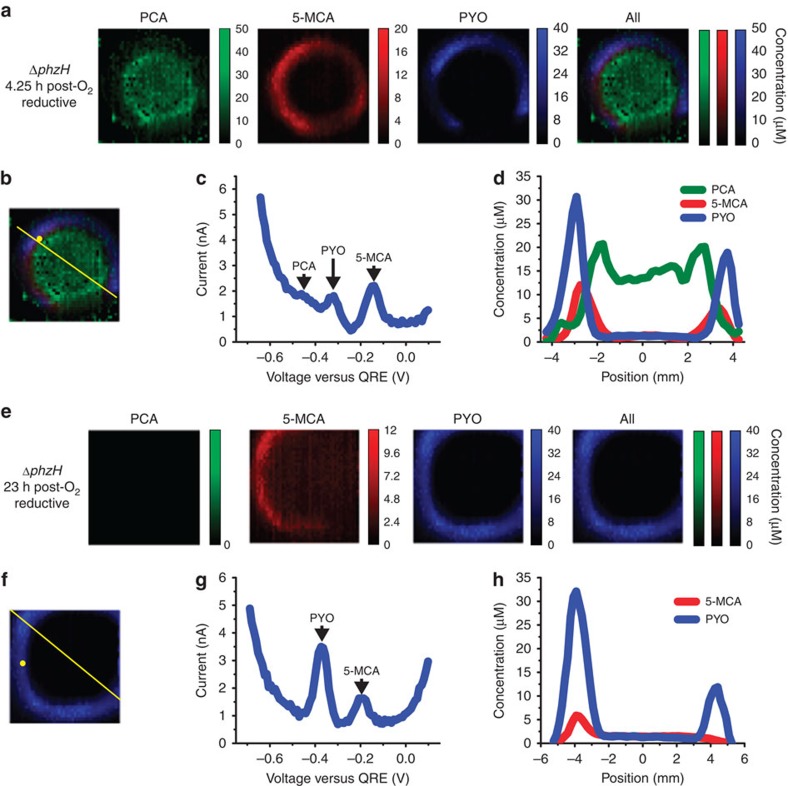
Figure 7. Electrochemical imaging of anaerobically grown ΔphzH biofilms following 4.25 and 23 h of oxygenation.
(a) Electrochemical imaging, based on reductive SWV, of a ΔphzH biofilm after 2 days of anaerobic growth and after 4.25 h of subsequent exposure to O2. Pixel intensity is proportional to phenazine concentration. PCA is shown in green, 5-MCA in red and PYO in blue. Maximum error due to electrode variability is 18 μM for PCA, 4 μM for 5-MCA and 4 μM for PYO. Images are 8 mm × 8 mm. (b) Locations of example square-wave voltammogram and cross-section in c,d, respectively. (c) Example square-wave voltammogram from a single electrode. (d) Example cross-section from the electrochemical image in a. (e) Electrochemical imaging, based on reductive SWV, of a ΔphzH biofilm after 2 days of growth and after 23 h of subsequent exposure to O2. Pixel intensity is proportional to phenazine concentration. 5-MCA is shown in red, and PYO in blue. Maximum error due to electrode variability is 4 μM for 5-MCA, and 4 μM for PYO. Images are 8 mm × 8 mm. (f) Locations of example square-wave voltammogram and cross-section in g,h, respectively. (g) Example square wave voltammogram from a single electrode. (h) Example cross-section from the electrochemical image in e.

