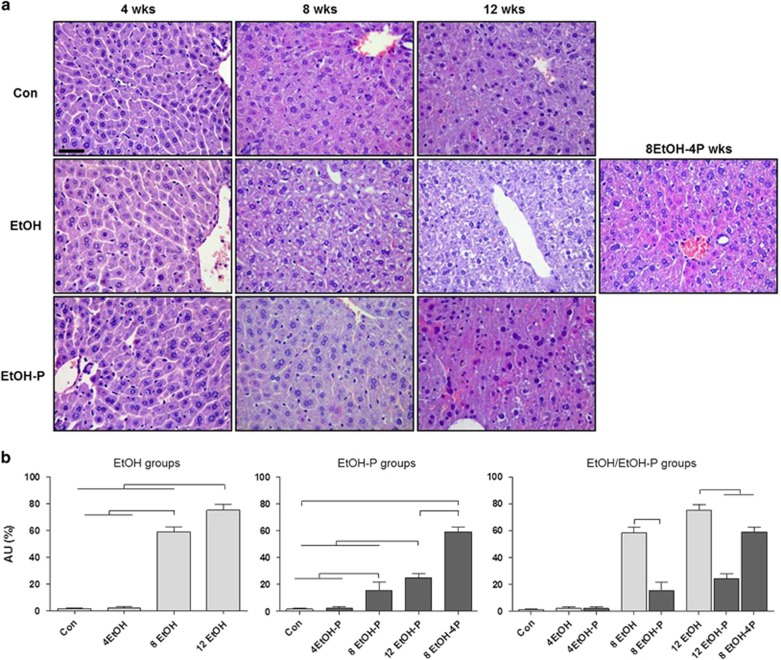
Figure 1.
Representative photomicrographs of liver sections stained with hematoxylin–eosin. (a) Liver histology of mice fed control (Con), ethanol (EtOH) diets, and ethanol and probiotic diet (EtOH-P). Bar=100 μm for all panels. (b) Histogram representing the degree of hepatic steatosis as determined by severity scores from I to III. The score is represented as percentage of steatosis (grade I=5–33% grade II=34–66% grade III=67–100%). Results are expressed as mean±s.d. In b, the horizontal lines on top of the histograms indicate a significant difference within the groups (P<0.001). For further explanation of abbreviations and model features see Table 1. AU, arbitrary unit; 4EtOH, ethanol-fed mice for 4 weeks; 8EtOH, ethanol-fed mice for 8 weeks; 12EtOH, ethanol-fed mice for 12 weeks; 4EtOH-P, ethanol and probiotic-fed mice for 4 weeks; 8EtOH-P, ethanol and probiotic-fed mice for 8 weeks; 12EtOH-P, ethanol and probiotic-fed mice for 12 weeks; 8EtOH-4P, ethanol-fed mice for 8 weeks and then given probiotic for 4 weeks; wks, weeks.

