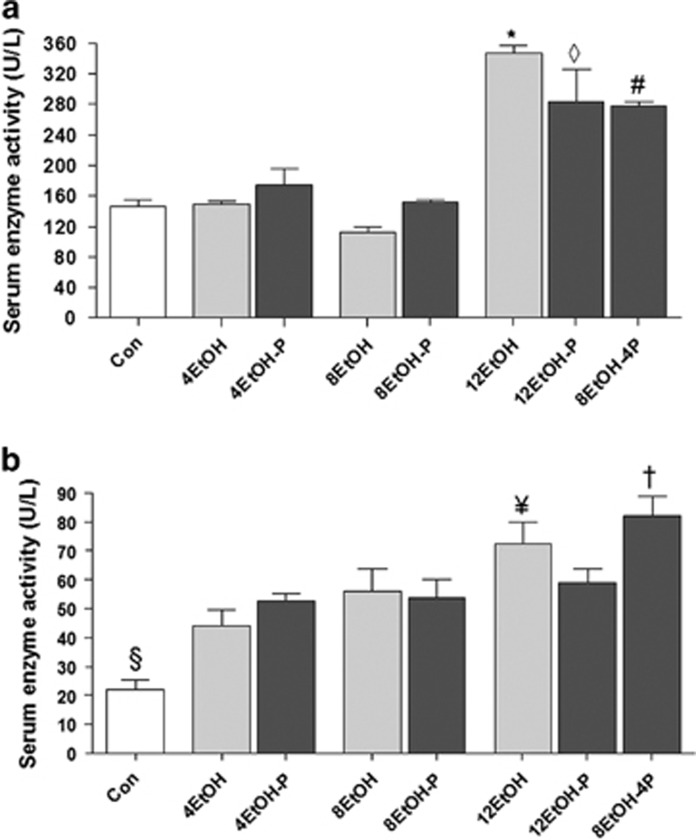
Figure 2.
Aspartate transaminase (AST) and alanine transaminase (ALT) levels in the serum of mice. Histograms showing (a) AST and (b) ALT levels. Each value is expressed as mean±s.d. *P<0.001 vs. Con, 4EtOH, 8EtOH, 12EtOH-P, and 8EtOH-4P; ◊P<0.001 vs. Con, 4EtOH-P, and 8EtOH-P; #P<0.001 vs. Con; §P<0.001 vs. all other groups; ¥P<0.05 vs. 4EtOH and 8EtOH; +P<0.001 vs. 12EtOH-P. For the meaning of the abbreviations in a and b, indicating each mouse group, see legend for Figure 1 and Table 1. Con, control; 4EtOH, ethanol-fed mice for 4 weeks; 8EtOH, ethanol-fed mice for 8 weeks; 12EtOH, ethanol-fed mice for 12 weeks; 4EtOH-P, ethanol and probiotic-fed mice for 4 weeks; 8EtOH-P, ethanol and probiotic-fed mice for 8 weeks; 12EtOH-P, ethanol and probiotic-fed mice for 12 weeks; 8EtOH-4P, ethanol-fed mice for 8 weeks and then given probiotic for 4 weeks.

