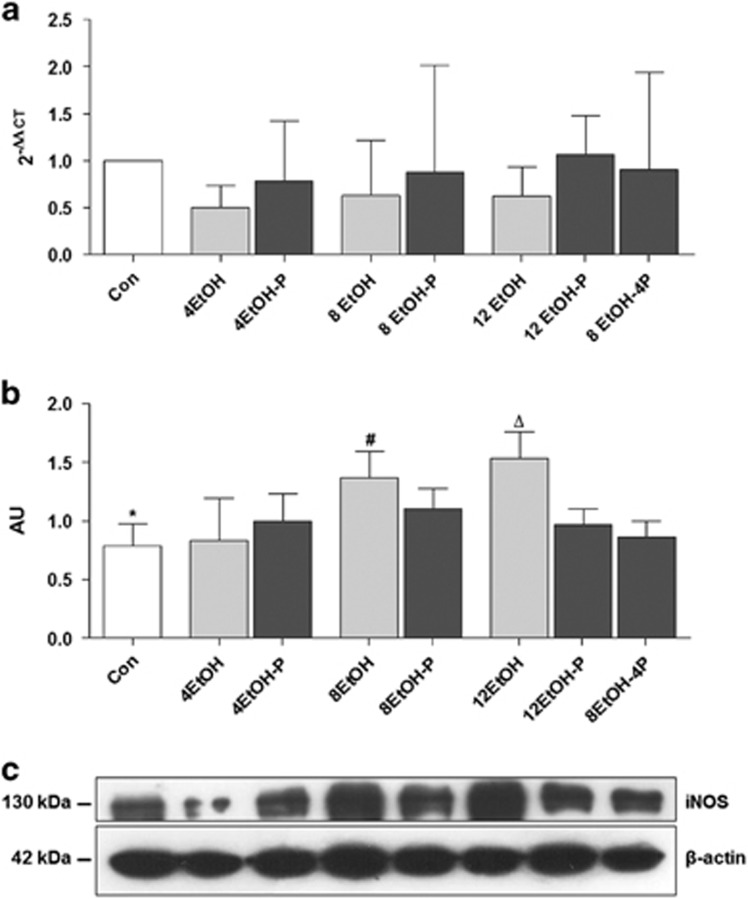
Figure 3.
Inducible form of NOS (iNOS) levels in the liver of control (Con) and ethanol (EtOH) fed mice. (a) The bars indicate the degree of the iNOS gene expression normalized for the reference genes, according to the Livak method (2−ΔΔCT), in the liver of control (Con), ethanol diets, and ethanol and probiotic diet mice. (b) Ratio iNOS levels/β-actin levels as a reflection of iNOS increase and decrease (mean±s.d.). One-way analysis of variance, Bonferroni post hoc test. (c) Representative cropped blots for iNOS in Con and EtOH-fed mice. The gels were run under the same experimental conditions and β-actin was used as an internal control. *P<0.01 vs. 8EtOH and 12EtOH; #P<0.01 vs. 4EtOH; ΔP<0.01 vs. 4EtOH, 12EtOH-P, and 8EtOH-4P. For the meaning of the abbreviations in a and b, indicating each mouse group, see legend for Figure 1 and Table 1. AU, arbitrary unit; Con, control; 4EtOH, ethanol-fed mice for 4 weeks; 8EtOH, ethanol-fed mice for 8 weeks; 12EtOH, ethanol-fed mice for 12 weeks; 4EtOH-P, ethanol and probiotic-fed mice for 4 weeks; 8EtOH-P, ethanol and probiotic-fed mice for 8 weeks; 12EtOH-P, ethanol and probiotic-fed mice for 12 weeks; 8EtOH-4P, ethanol-fed mice for 8 weeks and then given probiotic for 4 weeks.

