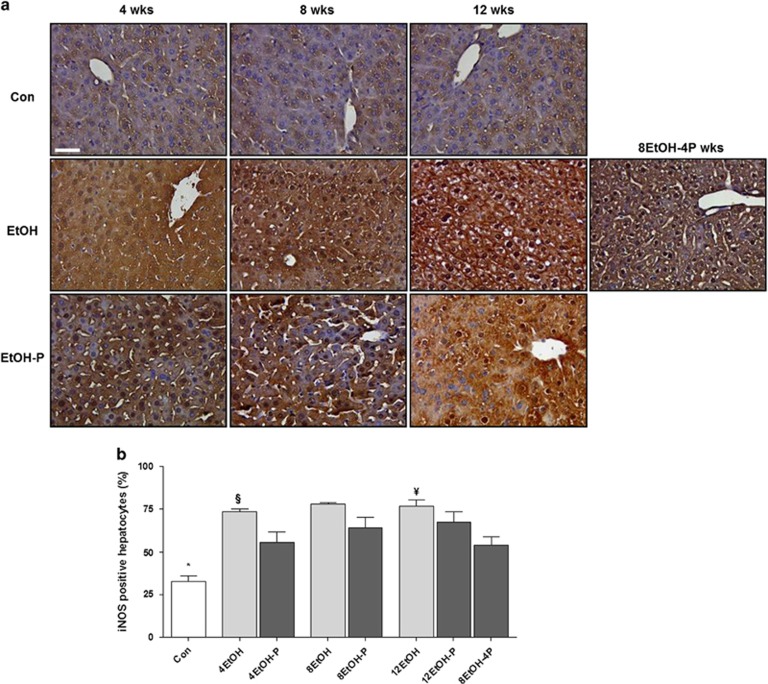
Figure 4.
Hepatocellular distribution of the inducible form of NOS (iNOS). (a) Representative photomicrographs of liver sections immunohistochemically stained for iNOS showing iNOS distribution both in the nucleus and the cytoplasm of hepatocytes. Strong staining for iNOS was present in the liver cells after 4, 8, and 12 weeks of alcohol intake, but when alcohol intake was accompanied with the probiotic, the staining intensity decreased. Bar=100 μm for all panels. (b) Histogram showing the percentages of hepatocytes positive for iNOS. The analysis was conducted in a blind manner (using coded slides with the observer not knowing the source of them) and the results are expressed as mean±s.d. *P<0.001 vs. all other groups; §P<0.01 vs. 4EtOH-P; ¥ P<0.001 vs. 8EtOH-4P. For the meaning of the abbreviations in a and b, indicating each mouse group, see legend for Figure 1 and Table 1. Con, control; 4EtOH, ethanol-fed mice for 4 weeks; 8EtOH, ethanol-fed mice for 8 weeks; 12EtOH, ethanol-fed mice for 12 weeks; 4EtOH-P, ethanol and probiotic-fed mice for 4 weeks; 8EtOH-P, ethanol and probiotic-fed mice for 8 weeks; 12EtOH-P, ethanol and probiotic-fed mice for 12 weeks; 8EtOH-4P, ethanol-fed mice for 8 weeks and then given probiotic for 4 weeks; wks, weeks.

