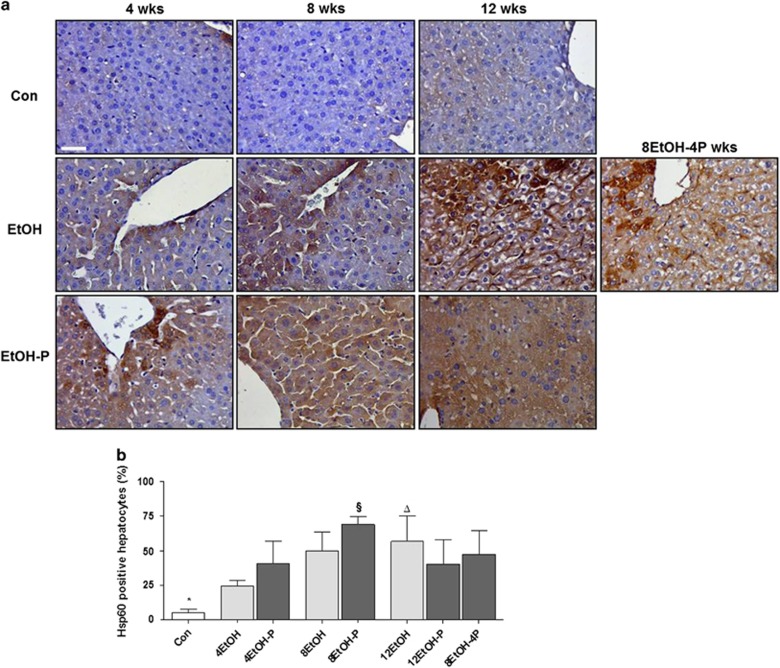
Figure 7.
Levels and preferential localization of Hsp60 in control and ethanol-fed mice. (a) Liver sections stained with a monoclonal antibody specific for Hp60. Bar=100 μm for all panels. (b) Histogram showing the percentages of hepatocytes positive to Hsp60. The analysis was conducted in a blind manner (using coded slides with the observer not knowing the source of them). *P<0.001 vs. all other groups (except for 4EtOH); ΔP<0.001 vs. 4EtOH; §P<0.05 vs. 4EtOH-P and 12EtOH-P. For the meaning of the abbreviations in a and b, indicating each mouse group, see legend for Figure 1 and Table 1. Con, Control; 4EtOH, ethanol-fed mice for 4 weeks; 8EtOH, ethanol-fed mice for 8 weeks; 12EtOH, ethanol-fed mice for 12 weeks; 4EtOH-P, ethanol and probiotic-fed mice for 4 weeks; 8EtOH-P, ethanol and probiotic-fed mice for 8 weeks; 12EtOH-P, ethanol and probiotic-fed mice for 12 weeks; 8EtOH-4P, ethanol-fed mice for 8 weeks and then given probiotic for 4 weeks; wks, weeks.

