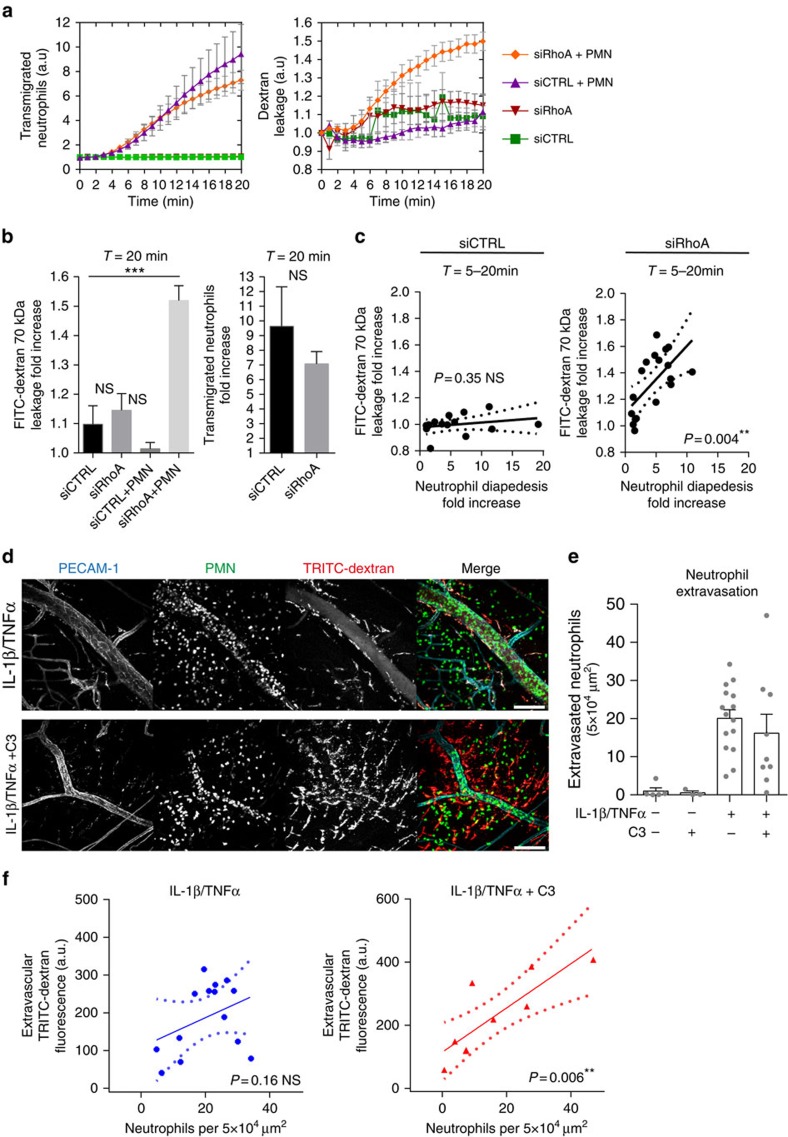
Figure 1. Impaired endothelial RhoA function results in increased vascular leakage during leukocyte diapedesis in vivo.
(a) Extravasation kinetics of calcein-red-labelled neutrophils and FITC–dextran through TNF-α treated ECs cultured on 3-μm pore permeable filtres. Neutrophils transmigrated towards a C5a chemotactic gradient in the lower compartment. Four conditions were tested; RhoA depletion (EC)+neutrophils (Orange line), control+neutrophils (purple line), RhoA depletion (EC) only (red line) and control only (green line). (b) Quantification of FITC–dextran and neutrophil extravasation after 20 min of neutrophil transmigration. Immunoblot of RhoA silencing can be found in supplementary fig. 8. (c) Correlation analysis of dextran and neutrophil extravasation kinetics through control and RhoA-depleted ECs. (d) Confocal intravital microscopy of 20–80 μm diameter cremasteric venulesin LysM–GFP mice (green neutrophils) immunostained in vivo for EC junctions by intrascrotal injections of fluorescent-labelled PECAM-1 (blue) and stimulated for four hours with IL-1β and TNF-α only, or with Rho-inhibitor (C3). A second dose of Rho inhibitor was given intrascrotally and TRITC–dextran (40 kDa) was injected intravenously at T=2 h and allowed to circulate until T=4 h. Scale bar, 100 μm. (e) Neutrophil extravasation in animals left unstimulated (control), stimulated with C3 alone, IL-1β/TNFα treated, IL-1β/TNFα treated+C3 or IL-1β/TNFα treated+neutrophil depletion. (f) Correlation analysis of dextran and neutrophil extravasation kinetics in animals stimulated with IL-1β/TNFα alone or with IL-1β/TNFα treated+C3. ***P<0.001 control versus RhoA-depleted HUVEC (ANOVA) or P=0.3504 control versus RhoA-depleted HUVEC (Student's t-test) (b). r=0.2547 P=0.359 (Pearson's correlation) transmigrated neutrophils versus FITC–dextran leakage in control HUVECs or r=0.6345 **P<0.01 (Pearson correlation) transmigrated neutrophils versus FITC–dextran leakage in RhoA-depleted HUVECs (c). P=0.4230 IL-1β/TNFα versus IL-1β/TNFα+C3 (Student's t-test) (e). r=0.8258 **P<0.01 (Pearson's correlation) transmigrated neutrophils versus FITC–dextran leakage in IL-1β/TNFα+Rho inhibitor treated mice (f). Data are from three experiments (a–c) or are representative of 5 to 13 (d–e) or 9 (f) independent experiments ((d–f) one mouse per experiment; error bars (a–c,e,f), s.e.m).

