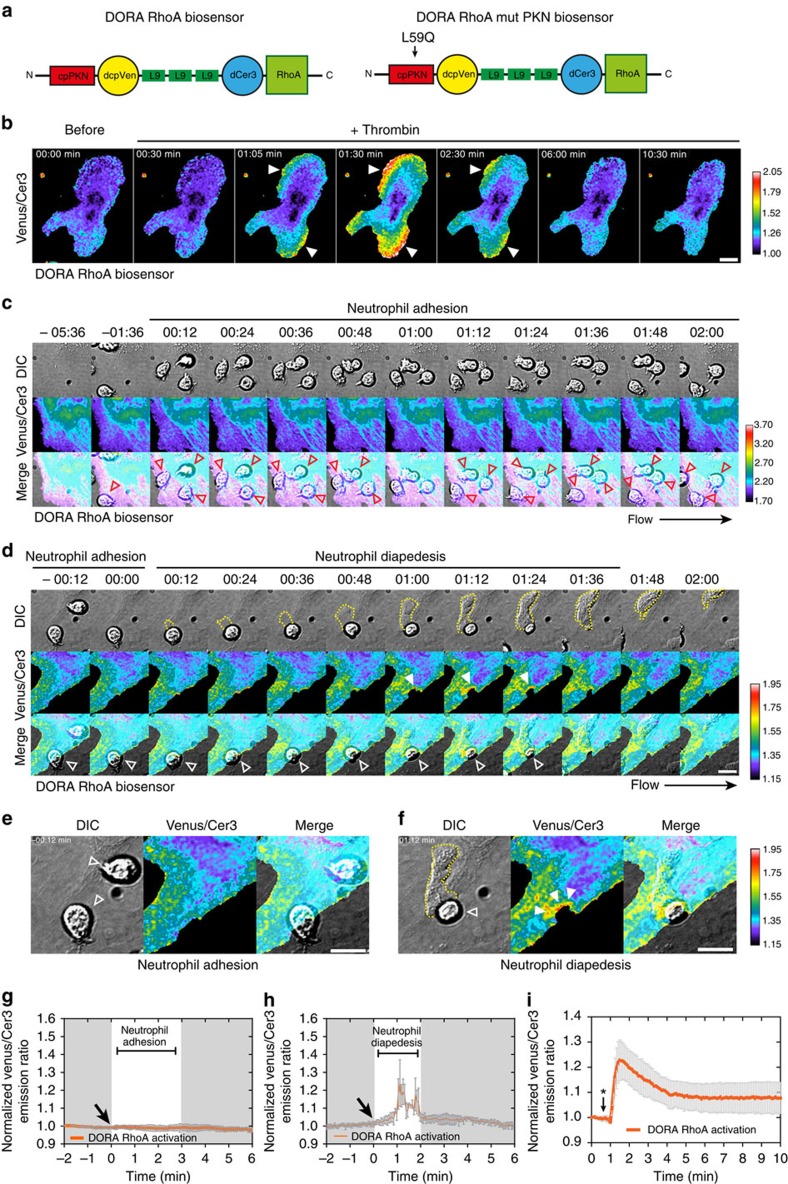
Figure 2. Spatiotemporal RhoA activation during neutrophil TEM.
Endothelial RhoA is locally and transiently activated during neutrophil extravasation (a) Schematic illustration of the DORA RhoA sensor design containing Rho effector PKN (red), circular permutated Venus (yellow), structured linker protein L9 (green), circular permutated Cer3 (blue) and RhoA GTPase (green),left panel. Right panel shows the DORA RhoA mutant PKN biosensor that was developed as a negative control biosensor, the glutamine was substituted for the leucine at position 59 in the PKN domain. This mutation prevents binding of PKN to activated RhoA. (b) Time-lapse Venus/Cer3 ratio images of DORA RhoA biosensor simultaneously recorded with an epi-fluorescent microscope showing spatiotemporal RhoA activation upon thrombin treatment (1 U ml−1) in HUVECs. Filled arrows indicate RhoA activation. Scale bar, 10 μm. Calibration bar shows RhoA activation (Red) relative to basal RhoA activity (Blue). (c) Epi-fluorescent live-cell imaging of HUVEC expressing the DORA RhoA biosensor during neutrophil adhesion under physiological flow conditions (0.8 dyne per cm2). Red open arrows indicate adherent neutrophils. Scale bar, 10 μm. Calibration bar shows RhoA activation (red) relative to basal RhoA activity (blue). (d) Epi-fluorescent live-cell imaging of HUVECs expressing the DORA RhoA biosensor during neutrophil TEM. Time-lapse images of DIC (upper) Venus/Cer3 ratio images of DORA RhoA biosensor (middle) and Merge (bottom) during leukocyte diapedesis. Open arrows indicates adherent neutrophil at the apical side of the endothelium. Filled arrows indicate local RhoA activation during neutrophil diapedesis. Scale bar, 10 μm. (e) Detailed zoom of RhoA activation during neutrophil adhesion (open arrows) prior diapedesis at time point t=−00:12 min. (f) Detailed zoom of local RhoA activation during neutrophil transmigration at time point t=01:12 min. Filled arrows indicate local RhoA activation during neutrophil diapedesis. Scale bar, 10 μm. (g) Quantification of temporal RhoA activation during multiple neutrophil transmigration events starting at time zero (arrow). (h) Quantification of temporal RhoA activation during multiple neutrophil adhesion events starting at time zero (arrow). (i) Quantification of DORA RhoA biosensor activation after thrombin treatment (1 U ml−1) in HUVEC. Asterisk indicates thrombin addition. Data represent mean and s.e.m of 7 experiments (g) 5 experiments and (h) 10 experiments (i).

