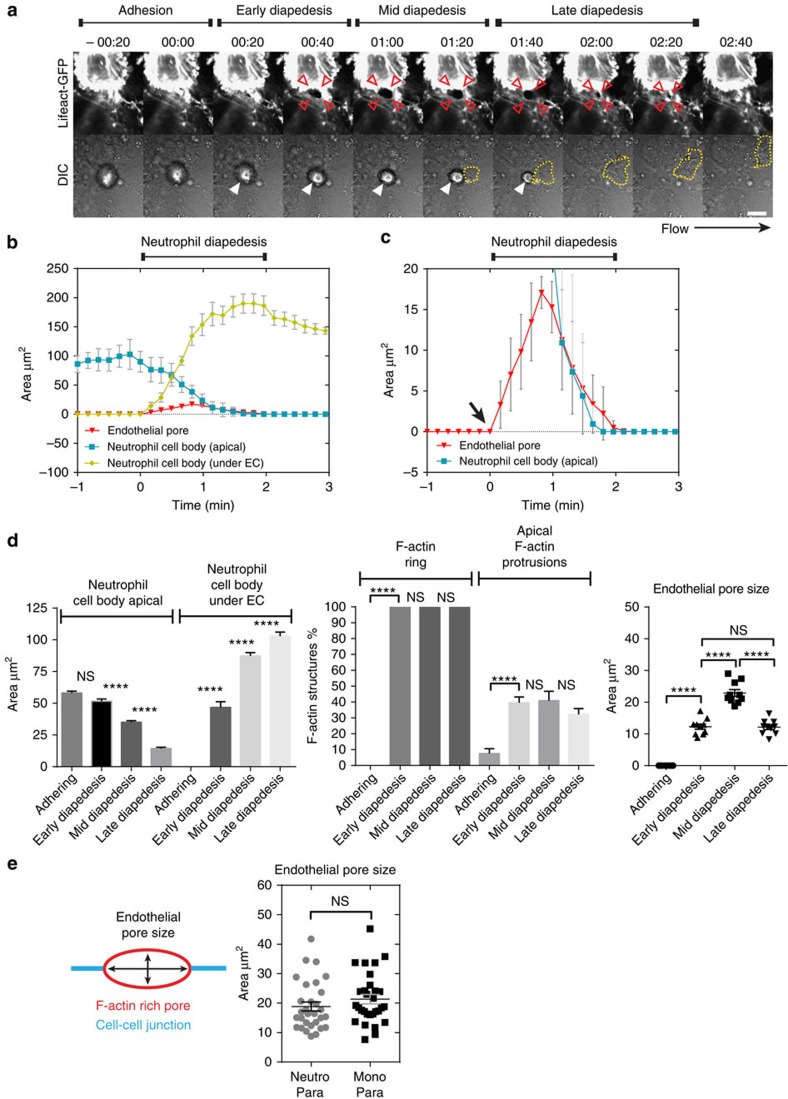
Figure 4. Endothelial pores formed during para- and transcellular leukocyte transmigration are confined in size.
(a) Epi-fluorescent live-cell imaging of ECs expressing Lifeact-GFP. Red open arrows indicate F-actin-rich endothelial pore formation during leukocyte diapedesis under physiological flow conditions (0.8 dyne per cm2). Filled arrows indicate extravasating leukocyte in DIC. Dashed lines indicates neutrophil localization under the endothelium. Scale bar, 10 μm. (b,c) Quantification of size changes occurring in the neutrophil cell body and endothelial pore during neutrophil diapedesis. Endothelial pore size (red), neutrophil cell body apical (blue) and neutrophil cell body under EC (yellow), diapedesis starts at time zero. (d) Quantification of Neutrophil size, F-actin-positive ring structures, F-actin positive apical protrusions and endothelial pore size. (e) Quantification of endothelial pore size for neutrophils and monocytes during paracellular migration. ****P<0.0001 (analysis of variance). Data are representative of four independent experiments (d,e) with 40 transmigration events per group. Data in b and c are representative of 10 transmigration events (error bars (b–e) s.e.m).

