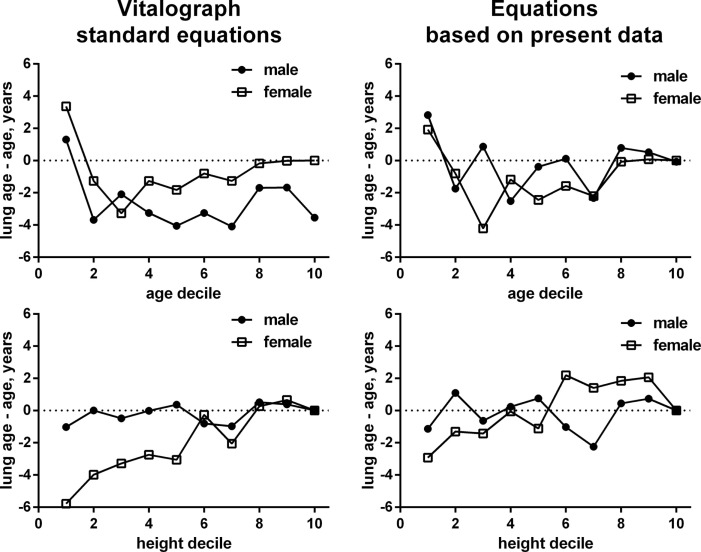
Figure 2.
Gender-specific associations between gender and chronological age (upper panels) and height (lower panels) for the difference between lung age and chronological age. Numbers in the left panels are based on the ECSC equations build into the Vitalograph, numbers in the right panels based on the empirically derived equations in non-smokers not reporting any airway condition. The scale of the x-axis represents deciles of male or female subjects for age and height. Each decile includes the data from 10% of subjects in ascending order of age or height, respectively, see Table 3. Note that the depiction based on our empirical equations may in part reflect a self-fulfilling prophecy as some of the data went into the derivation of the equation and the depicted data.

