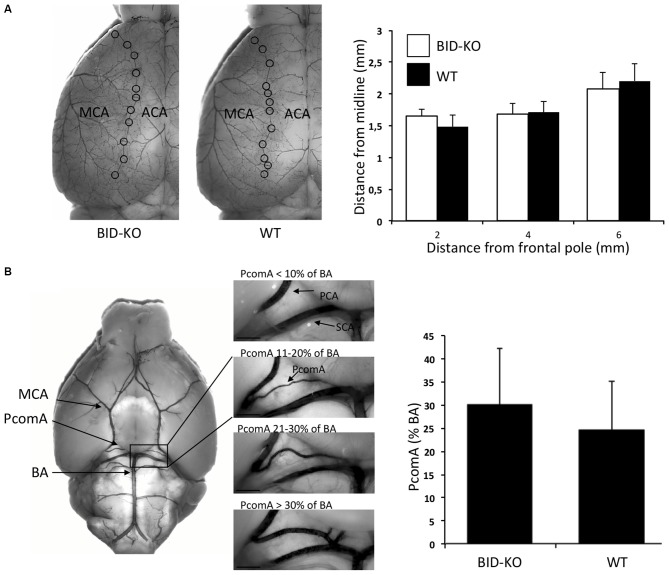
Figure 3.
Cerebrovascular anatomy. (A) The territory of the middle cerebral artery (MCA) was measured as the distance from the line of anastomoses between the MCA and the anterior cerebral artery (ACA) to the midline at 2, 4 and 6 mm from the frontal pole. The cerebrovascular anatomy was analyzed by visualizing the arteries with cresyl violet solution. We observed no significant difference between BID-KO mice and WT mice at any of these three sites (p = 0.96, n = 10–13 in each group, 2-way ANOVA mean ± SD). (B) The diameters of the posterior communicating arteries (PcomAs) were measured at the widest part and the values were calculated as a percentage of the basilar artery (BA) diameter. We found no significant difference between the two groups of mice (p = 0.11, n = 10–13 in each group, non-paired t-test, mean ± SD). SCA: Superior cerebellar artery.

