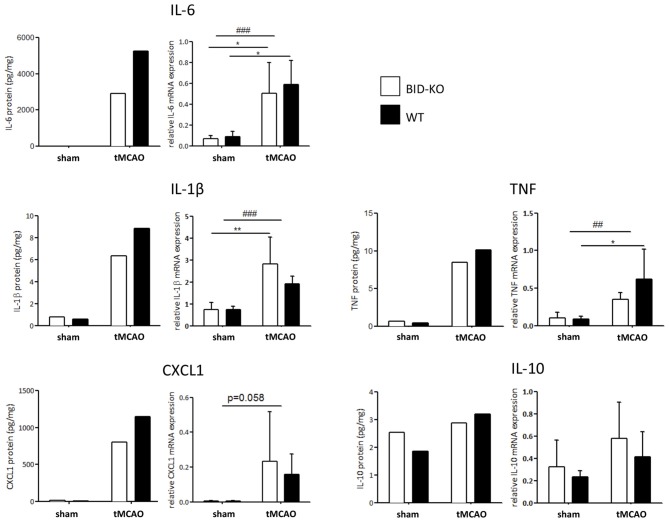
Figure 8.
Expression of cytokines and chemokines. The expression level of various cytokines and chemokines were evaluated on protein level by mesoscale multiplex analysis of pooled samples (pool from 3 mice in each sham group, and 5–6 mice in each tMCAO group), and on mRNA by qPCR of non-pooled samples. As expected, the expression was generally elevated after tMCAO on both protein and mRNA level (*p < 0.05, **p < 0.01, ##p < 0.01, ###p < 0.001). When comparing the expression between the two groups of mice after tMCAO there was an overall reduction in protein levels in the BID-KO mice compared to WT mice. The biggest reduction of expression in BID-KO mice was found for IL-6 which was reduced by ~45%. For CXCL1 protein the expression was reduced by ~30%, IL-1β protein by ~28%, TNF protein by ~16% and IL-10 protein by ~9%. However, all cytokines and chemokines were not reduced in BID-KO mice compared to WT mice on mRNA level, and there was no significant difference for any of the examined cytokines and chemokines (IL-6: p = 0.65, IL-1β: p = 0.27, CXCL1: p = 0.7, TNF: p = 0.33, IL-10: p = 0.33, 2-way ANOVA, mean ± SD).

