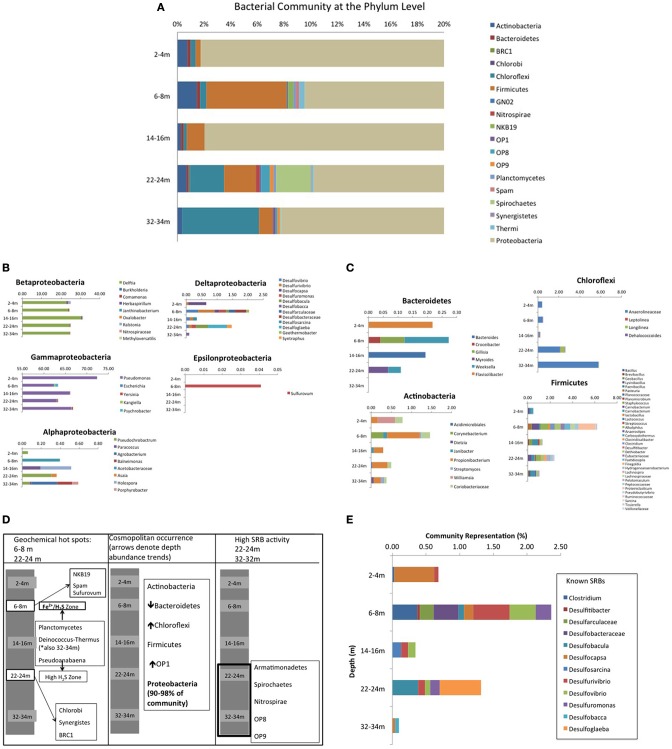
Figure 5.
(A) CT bacterial community diversity with depth, organized at the Phylum level. Due to the dominance of Proteobacteria (90–98% of total community), the x-axis has been magnified to represent 0–20% of community diversity (where anything beyond 14% is Proteobacteria) to highlight the other contributing Phyla. (B) Depth dependent Proteobacterial class trends for the 5 sampled depths in the CT deposit. (C) Non Proteobacteria cosmopolitan Phyla depth dependent trends for the 5 sampled depths in the CT deposit. (D) Non cosmopolitan Phyla depth dependent trends for the 5 sampled depths in the CT deposit. (E) Depth dependent trends of known SRB for the 5 sampled depths in the CT deposit.

