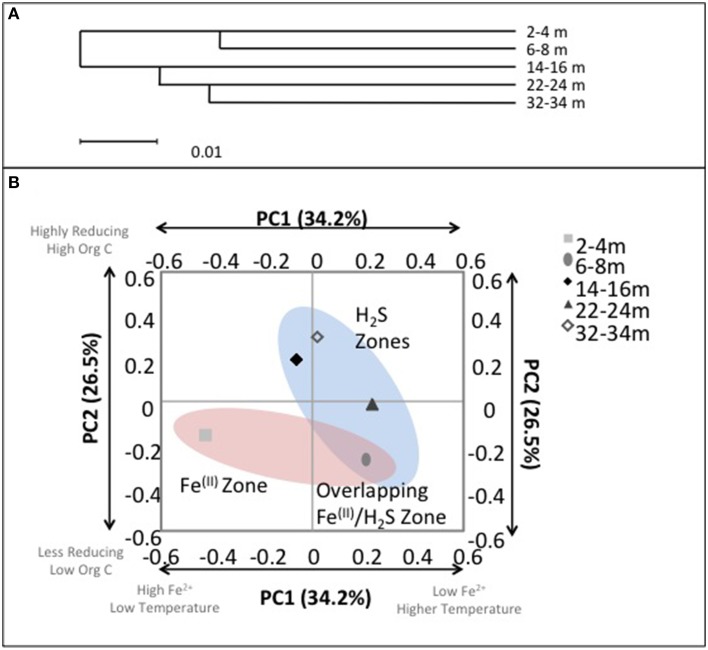
Figure 7.
(A) UniFrac cluster analysis illustrating the similarities between bacterial communities with depth. (B) Microbial community composition with depth in CT deposit as a function of principal components 1 (PC1) and 2 (PC2). Axis labels refer to the principal components and the total percentage of variance explained by each component. Text boxes identify correlated environmental characteristics associated with microbial community composition: ORP and conductivity (weakly negatively correlated with PC1, p < 0.1) and organic C (negatively correlated with PC2, p < 0.05). Highlighted clusters correspond with zones of observed porewater [∑H2S] and [Fe2+].

