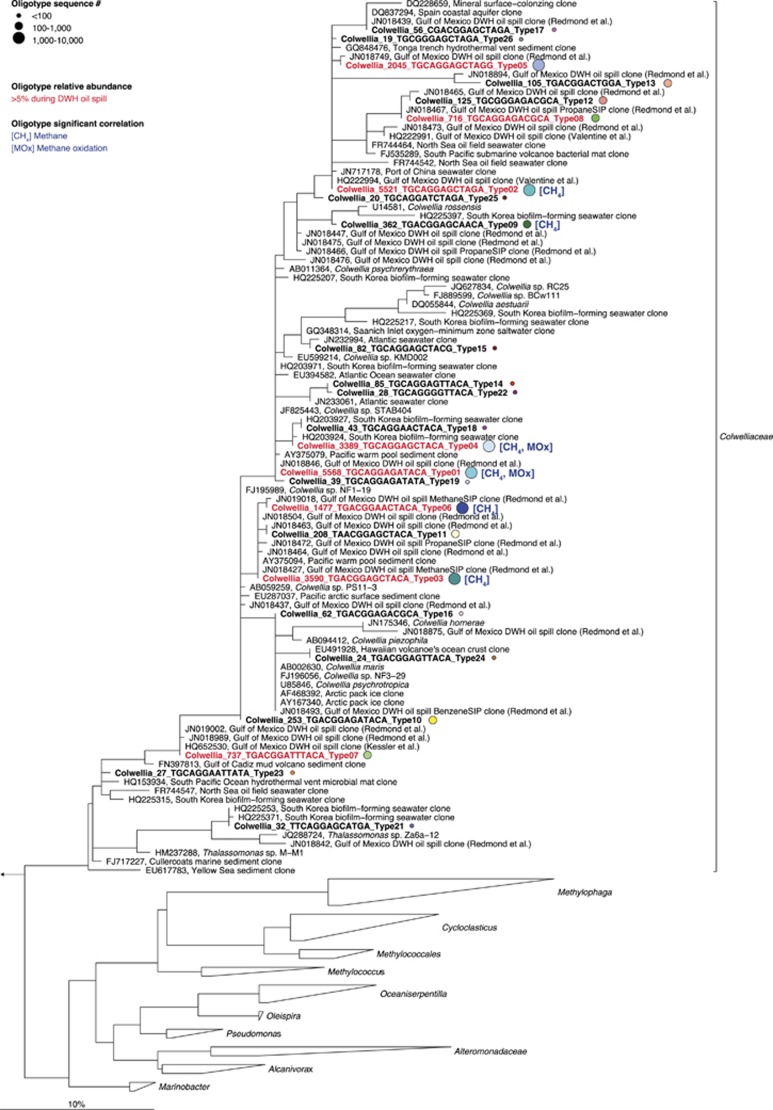
Figure 4.
Phylogenetic relationships of Colwellia oligotypes (bold) with closely related spp. including cultured representatives. The tree was calculated by maximum-likelihood analysis. Oligotypes that were potentially more active during the DWH oil discharge are shown in red-colored font. Color-coding of spheres corresponds to oligotype labeling in Figure 3. Furthermore, oligotypes that significantly correlate with methane and/or methane oxidation are labeled with [CH4] and/or [MOx]. The number of reads that clustered into the same oligotype is given in the full name. The bar represents 10% estimated sequence divergence.

