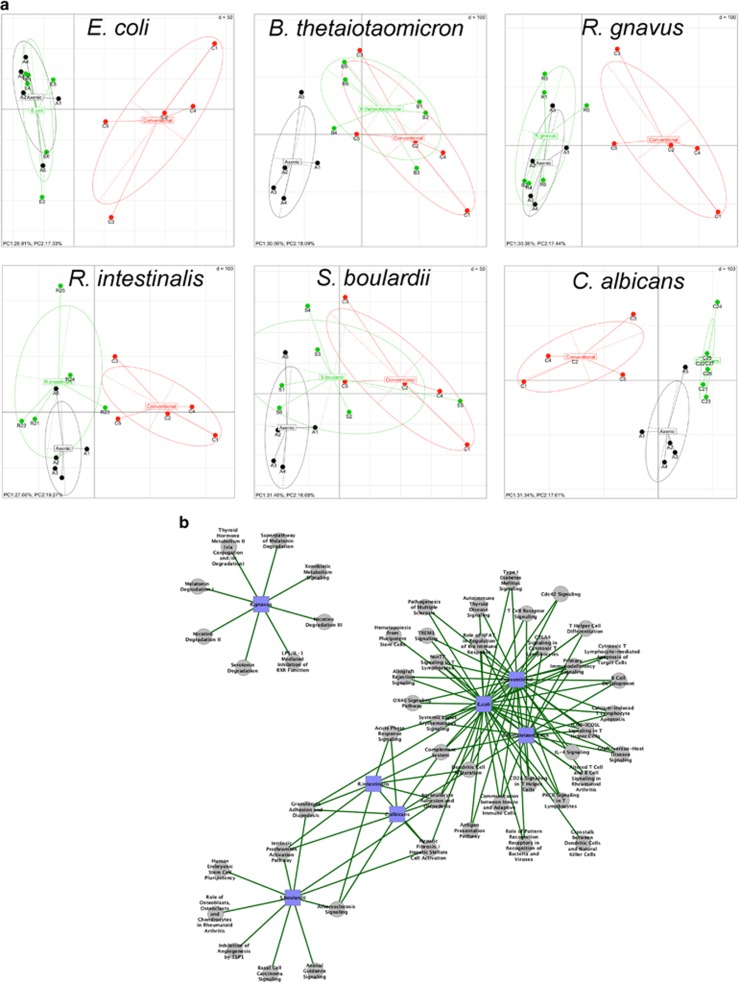
Figure 3.
Colon gene expression in mono-associated mice using microarray technology. (a) Gene expression in mouse colon was analyzed by principal component analysis. The ellipses delimit mono-associated group (monoxenic, in green), germ-free group (axenic, in black) and conventionalized group (conventional, in red). The axes correspond to principal component 1 (x axis) and 2 (y axis). (b) Interaction network established with Cytoscape and showing nodes and connections between significantly enriched ingenuity canonical pathways, in each mono-associated group when compared with germ-free mice. The gray circle nodes represent the ingenuity canonical pathways and the blue square nodes represent the mono-associated group compared with germ-free mice. The green edge links represent significantly upregulated functions/pathways in mono-associated groups compared to germ-free group. Significant level was fixed at α=0.05.

