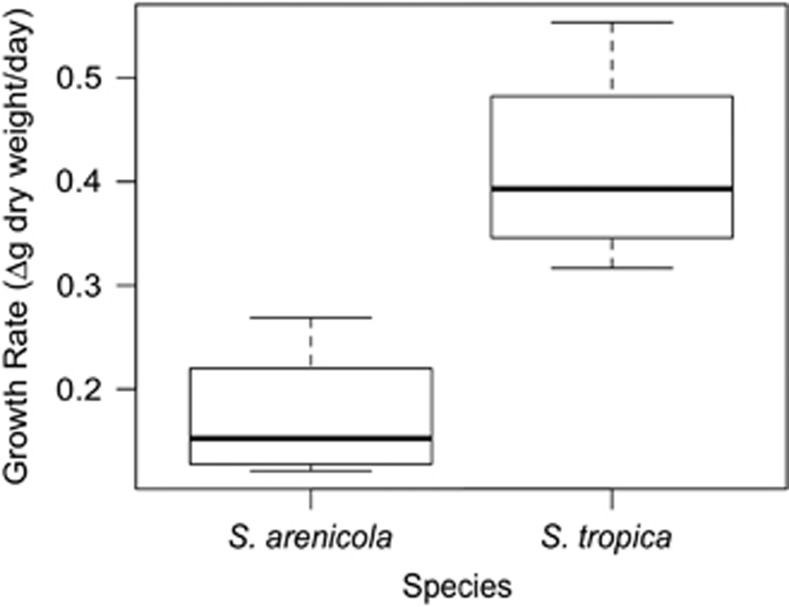
Figure 5.
Salinispora growth rates. For each box, the dark horizontal bar represents the median value for the change in dry weight/day of the filtered cell biomass collected during exponential growth phase. The box edges represent the upper and lower quartiles of the data, and the whiskers represent the minimum and maximum values. The plot contains data from four strains of each species grown in triplicate.

