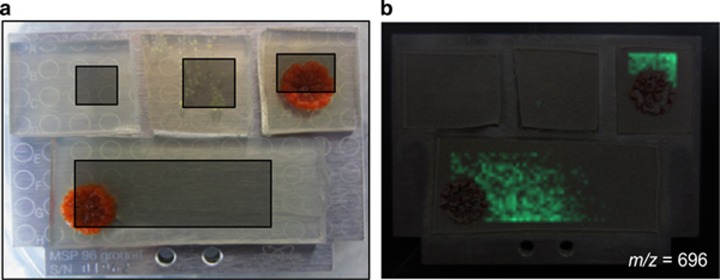
Figure 6.
MALDI-TOF imaging mass spectrometry of an S. arenicola CNY-679 interaction with Kytococcus sp. CUA-766. (a) MALDI plate setup with control samples in the top row, from left to right: media blank, Kytococcus sp. CUA-766 monoculture, S. arenicola CNY-679 monoculture. The sample in the bottom row contains the zone of inhibition between the two strains. The gray boxes define the areas chosen for imaging. (b) Spatial distribution of the m/z 696 ion, an exact match to rifamycin S (M+H), shown in green surrounding the S. arenicola colony and diffusing outwards toward the inhibited bacterial strain. This ion was observed in the S. arenicola monoculture but not in the medium blank or the Kytococcus sp. monoculture.

