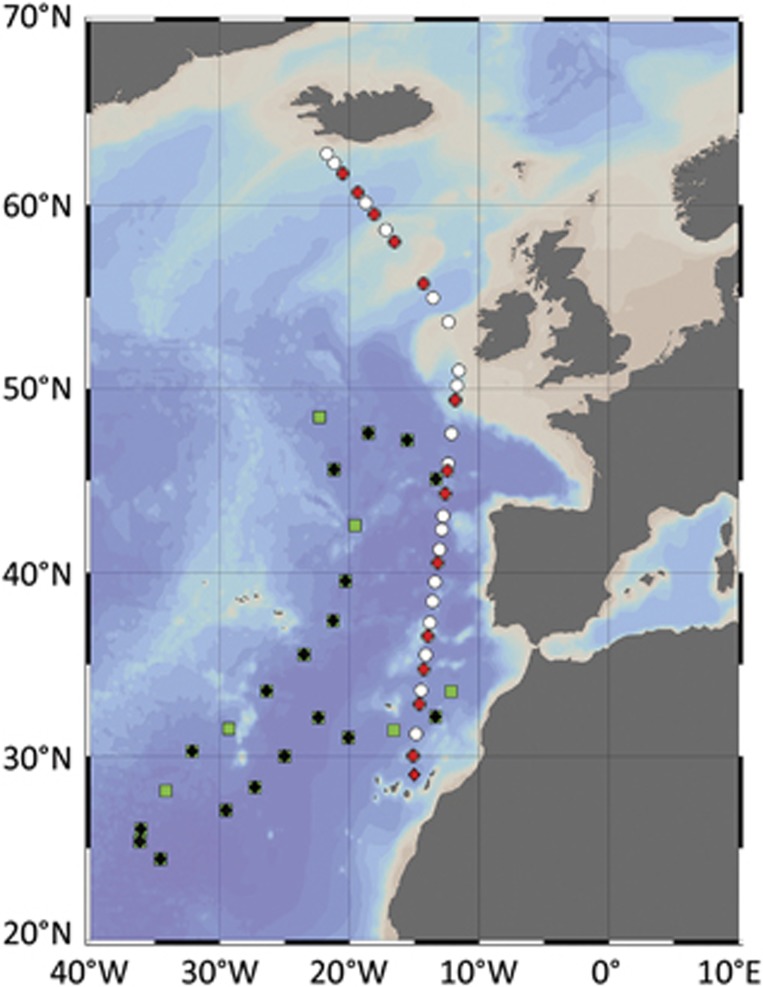
Figure 1.
Bathymetric map of the stations sampled during the cruises STRATIPHYT (white circles and red diamonds) and MEDEA (green squares and black diamonds). Modified dilution assays to determine viral lysis and microzooplankton grazing rates were performed at stations indicated by the red and black diamonds. Cruise track was prepared using Ocean Data View (ODV version 4.6.5, Schlitzer, 2002).

