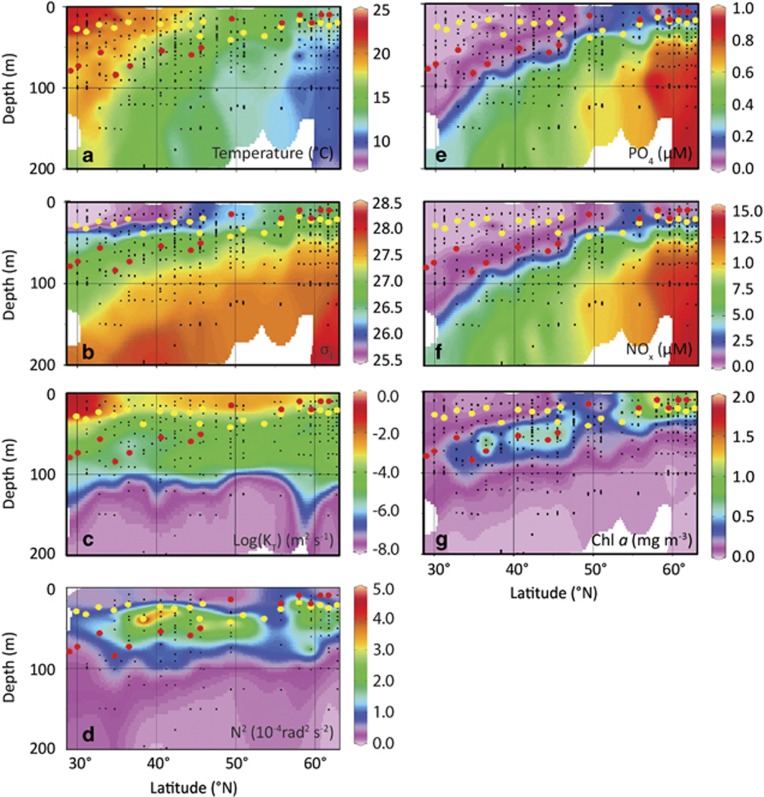
Figure 3.
Latitudinal and depth distribution of (a) temperature, (b) σT, (c) temperature eddy diffusivity (KT), (d) Brunt–Väisälä frequency (N2), (e) inorganic phosphorus, (f) NOx (nitrate+nitrite) and (g) Chl a concentrations measured during STRATIPHYT. Black dots indicate sampling points, yellow dots indicate ML depth (Zm) and red dots indicate the sampling depths for modified dilution assays. Figure panels were prepared using Ocean Data View (ODV version 4.6.5, Schlitzer, 2002).

