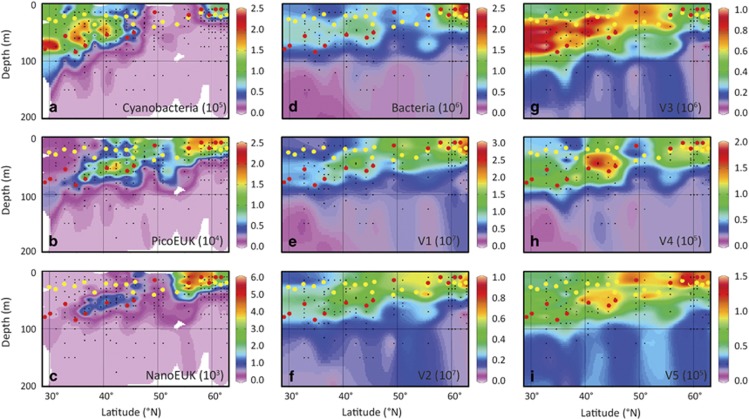
Figure 4.
Biogeographical distributions of phytoplankton (a–c), bacteria (d) and virus groups (e–i) across the Northeast Atlantic Ocean based on flow cytometry counts obtained during the STRATIPHYT cruise. Abundances are expressed in (a–c) cells per ml, (d) bacteria per ml and (e–i) viruses per ml. Black dots indicate sampling points, yellow dots indicate ML depth (Zm) and red dots indicate the sampling depths for modified dilution assays. Graphs were prepared with Ocean Data View (ODV version 4.6.5, Schlitzer, 2002).

