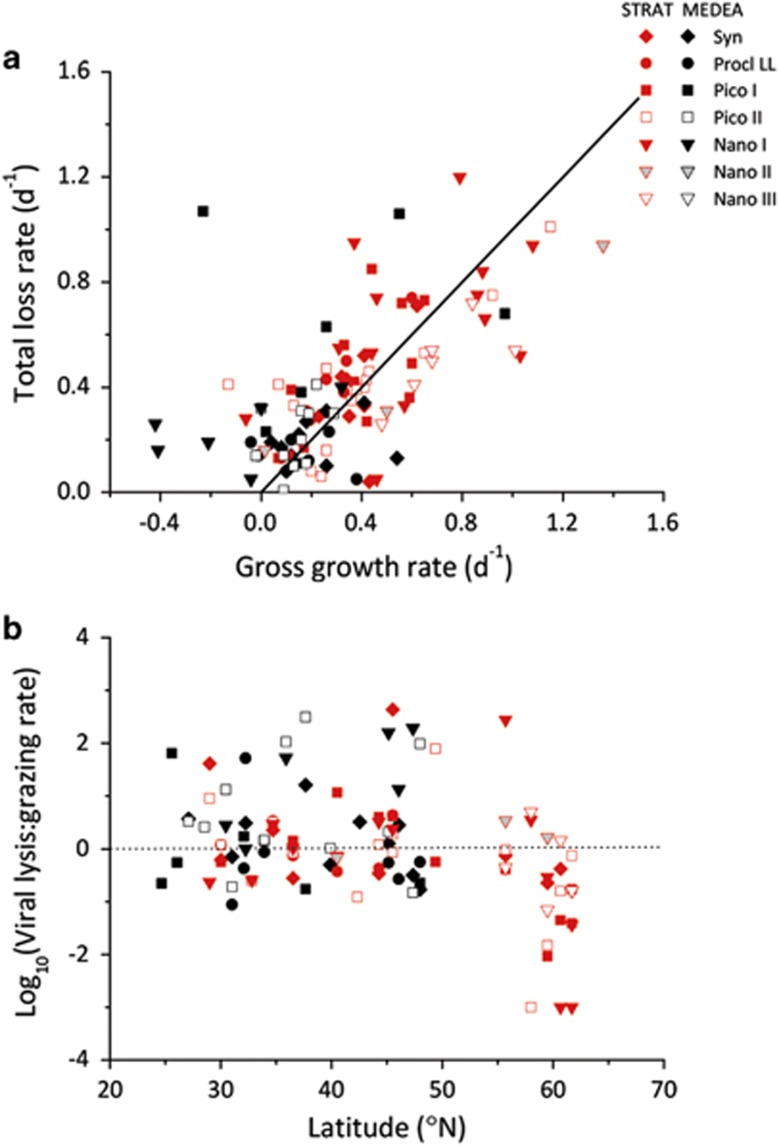
Figure 7.
The contribution of viral lysis to phytoplankton mortality. (a) Relationship between the total loss rate (grazing+viral lysis) and gross growth rate of the seven phytoplankton groups (<20 μm). The black line indicates a 1:1 relationship. (b) Ratio of viral lysis to microzooplankton grazing rates for each of the seven phytoplankton groups (<20 μm) distinguished by flow cytometry, as function of latitude. Rates were obtained by the modified dilution technique during the STRATIPHYT (red symbols) and MEDEA (black symbols) cruises. High-light-adapted Prochlorococcus were not included, as they were largely absent at the depths sampled for the modified dilution assays. Dotted line indicates a 1:1 relationship of viral lysis to grazing.

